How Do I Generate a Capability Combination Report in Excel Using SigmaXL?
SigmaXL Capability Combination Reports bring process capability statistics and control charts together in single views for both Individuals and Subgroups data. They report capability indices such as Cp, Cpk, Pp, Ppk, and Cpm alongside the supporting charts, and serve as a comprehensive alternative to capability six pack style reports for users comparing capability analysis tools in Excel.
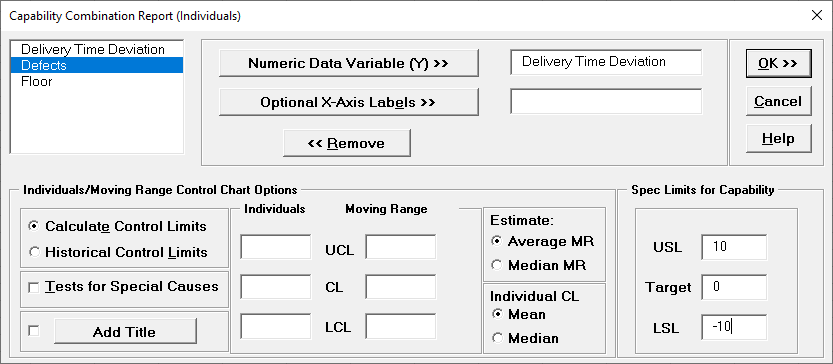
Select Delivery Time Deviation, click
Numeric Data Variable (Y) >>. Enter USL = 10,
Target = 0, LSL = -10, as shown below:
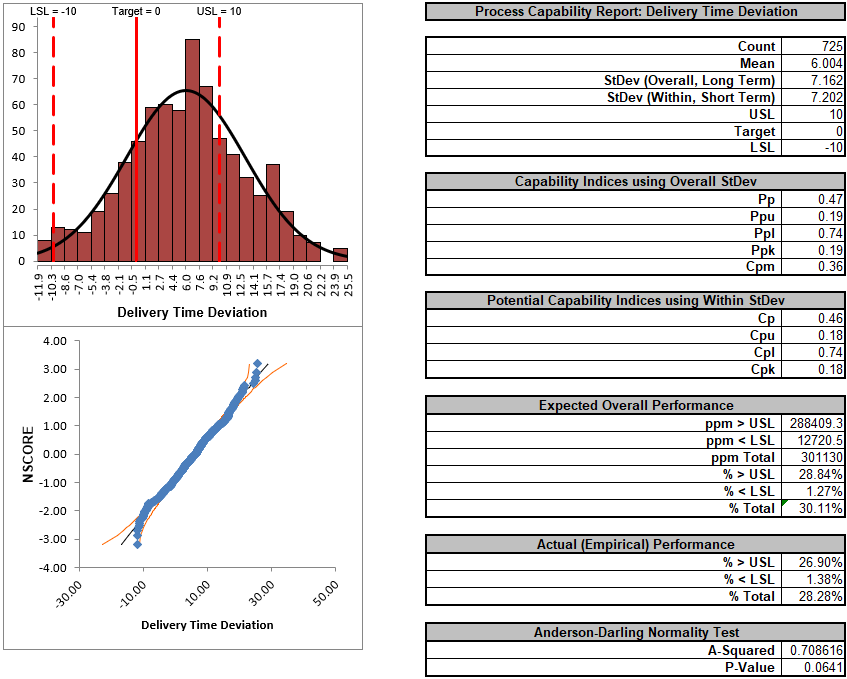
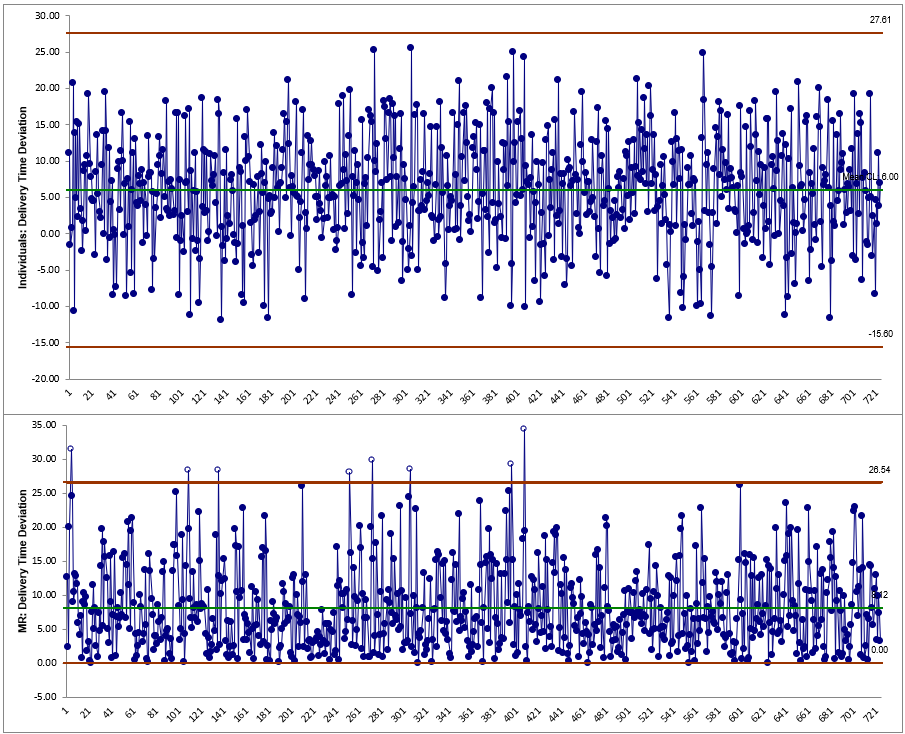
Click OK. The resulting
Process Capability Combination report is shown below:
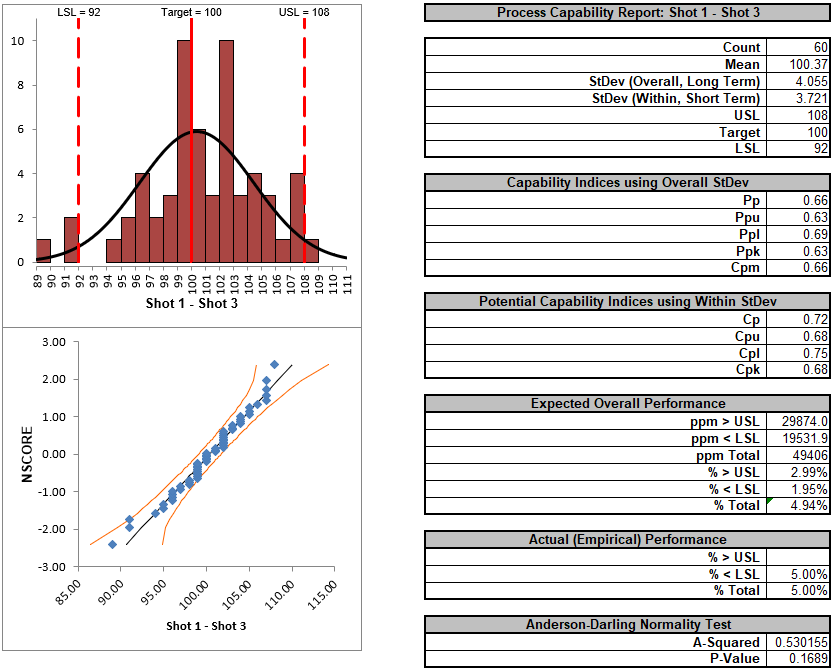
Cp is the best case potential capability index. Ppk is the worst
case actual performance. If Cp is excellent (say Cp =2) and Ppk is poor (say Ppk <
1), this indicates that the process can be dramatically improved through centering and
stabilizing. If Cp is poor, you will have to implement fundamental improvements using
DMAIC to address common cause variation. If Ppk = Cp, this indicates that the process is
centered and stable, and the short-term (within subgroup) variation is the same as the
long-term (overall) variation.
Cpm is a similar statistic but it incorporates a penalty for
deviation from target.
On a technical note regarding compatibility with other software
tools, please be advised that SigmaXL does not use unbiasing constants when calculating
Overall StDev, Pp, Ppk and Cpm. This is done in order to ensure that the calculated
Overall StDev matches the results given in Descriptive Statistics. Note that Within
StDev, Cp and Cpk are based on control chart techniques (MR-bar/d2 for Individuals
Chart, R-bar/d2 for X-Bar & R, S-bar/c4 for X-Bar & S).
Capability Combination Report (Subgroups)
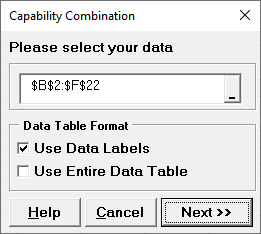
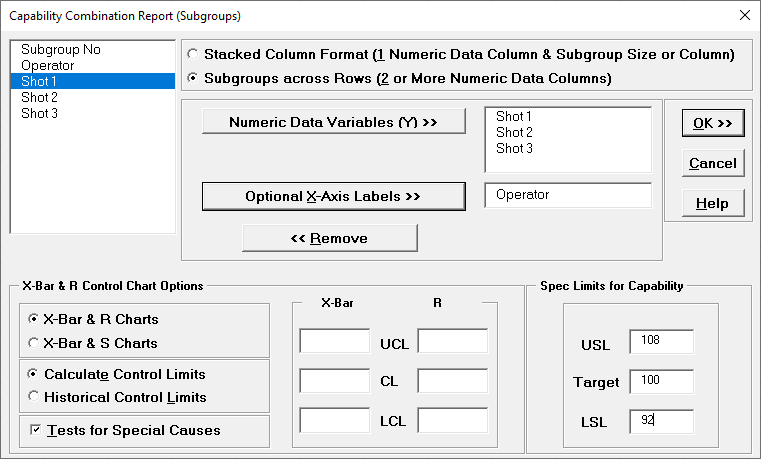
Open the file Catapult Data Xbar Control Charts.xlsx. Each operator fires the catapult ball 3 times. The target distance is 100 inches. The Upper Specification Limit (USL) is 108 inches. The Lower Specification Limit (LSL) is 92 inches.