How Do I Perform ANOM Variances Test in Excel Using SigmaXL?
The ANOM Variances chart is complementary to Bartlett’s Test for Equal Variance and is also
available as an option in the Bartlett’s Test dialog. It assumes that the data are normally
distributed.
Open Delivery Times.xlsx, click on
Sheet 1 tab.
Click SigmaXL > Graphical Tools > Analysis of Means
(ANOM) > ANOM Variances. Ensure that
the entire data table is selected. If not, check Use
Entire Data Table.
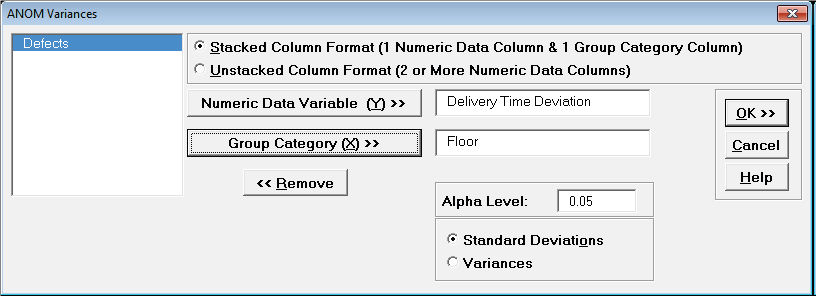
Click Next. Ensure that Stacked
Column Format is checked. Select Delivery Time
Deviation,
click Numeric Data Variable (Y) >>; select
Floor, click Group Category (X) >>; Select
Standard
Deviations; Set Alpha Level = 0.05.
We are analyzing the same normal data used in Bartlett’s Test
for Equal Variances.
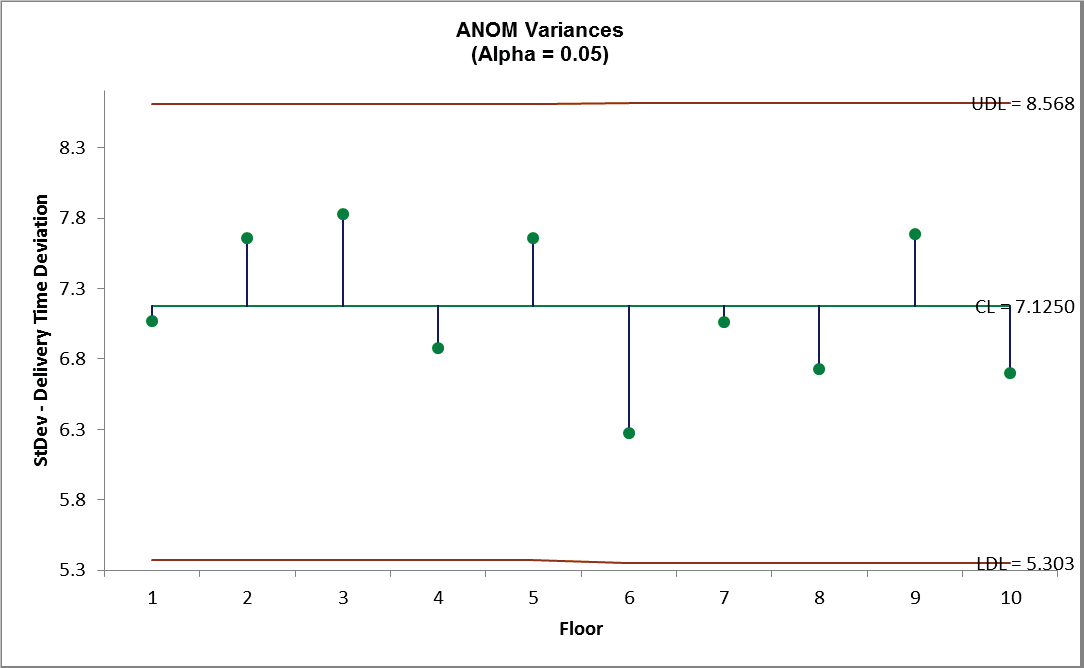
Click OK. The ANOM Variances chart is
shown below:
The ANOM Variances chart visually shows
that none of the group standard deviations are
significantly different from the grand mean of all the standard
deviations. It is called an ANOM
Variances Chart but displays Standard Deviations for ease of
interpretation (similar to a
Standard Deviation S Control Chart). This does however result in
non-symmetrical decision
limits. To display Variances rerun the above analysis with
option Variances selected.
Define, Measure, Analyze, Improve, Control
Simulate, Optimize, Realize
Web Demos
Our CTO and Co-Founder, John Noguera, regularly hosts free Web Demos featuring SigmaXL and DiscoverSim Click here to view some now!


 Facebook
 LinkedIn
 YouTube