Basic Statistical Templates 2 Proportions Equivalence Test
Click SigmaXL > Templates &
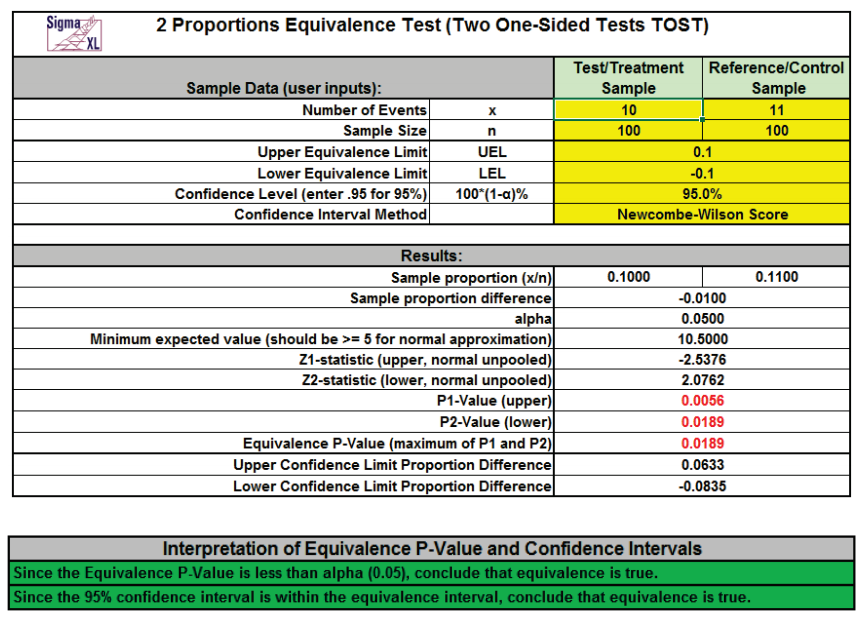
Calculators > Basic Statistical Templates > 2 Proportions Equivalence Test to access the 2 Proportions Equivalence Test (Two One-Sided Tests TOST) calculator. The
template gives the following default example.
Notes
- Enter summarized Sample Data, Upper & Lower Equivalence Limits and Confidence Level in
cells with yellow highlight. Do not modify any other part of this worksheet.
- Select Confidence Interval Method using drop-down.
- Confidence intervals for difference in binomial proportions have
an "oscillation" phenomenon
where the coverage probability varies with n and p.
- Newcombe-Wilson Score is recommended and has a mean coverage
probability that is close to the
specified confidence interval. (See Newcombe method 10).
- Newcombe-Wilson Score (CC = Continuity Corrected) is
conservative and will typically meet the
specified confidence level as a minimum coverage probability, but
results in wider intervals. (See
Newcombe method 11).
- Jeffreys-Perks is similar to Newcombe-Wilson, and included as an
option because it is the preferred
interval for some practitioners. (See Radhakrishna; Newcombe method
4).
- Normal Approximation will match the P-Value calculations, but
should only be used when minimum
expected cell value, shown above, is >= 5.
- Exact methods that are strictly conservative (like
Clopper-Pearson for the one proportion case) are
not included in this template because they are computationally
intensive and slow.
- Null hypothesis for P1: Proportion Difference >= UEL; Null
hypothesis for P2: Proportion
Difference <= LEL. Both null hypotheses must be rejected to conclude
that equivalence is true.
The P-Values are based on the normal approximation unpooled method. -
LEL and UEL establish the zone or region of equivalence and are
determined by what size
proportion difference is considered practically significant.
- Since the confidence interval options use different methods than the
hypothesis test (except
for Normal option), it is possible that the conclusion from the
Equivalence P-Value will be
different from that of the confidence interval. In this case, we
recommend using just the
confidence interval method.
- Due to the complexity of calculations, this template uses VBA macros
rather than Excel
formulas. SigmaXL must be initialized and appear on the menu in order
for this template to
function.
References:
1. Beal, S. L. (1987), Asymptotic confidence intervals for the difference
between two binomial parameters for
use with small samples. Biometrics, 43, 941-950.
2. Newcombe, R. G. (1998b), Interval estimation for the difference
between independent proportions:
Comparison of eleven methods. Statistics in Medicine, 17:873890.
3. Radhakrishna S., Murthy B.N., Nair N.G., Jayabal P., Jayasri R. (1992),
Confidence intervals in medical
research. Indian J Med Res., Jun;96:199-205.


