How Do I Create a Scatter Plot Matrix in Excel Using SigmaXL?
Scatter Plot Matrix
Click Sheet 1 Tab of Customer Data.xlsx (or press
F4 to activate last worksheet). Click SigmaXL > Graphical Tools > Scatter Plot Matrix.
Ensure that entire data table is selected. If not, check
Use Entire Data Table. Click Next.
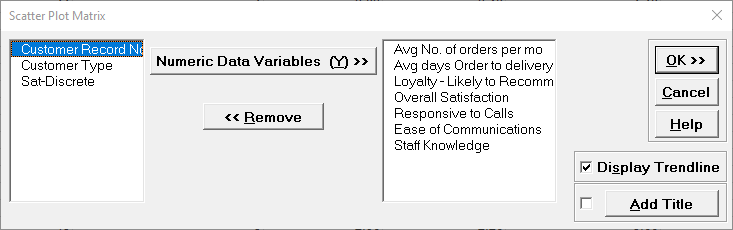
Select the variable Avg No. of orders per month; shift-click on
Staff Knowledge and click Numeric Data Variables (Y) >> as shown:
Click OK.
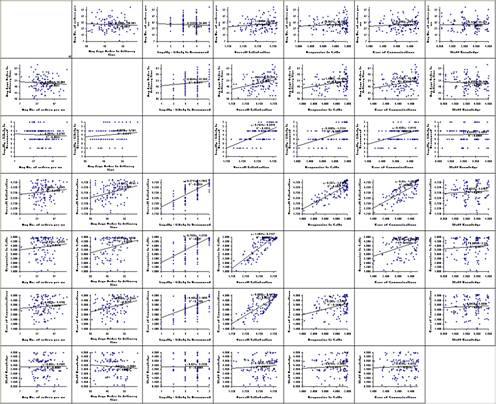
Resulting Scatter Plot Matrix:
Of particular interest is Overall Satisfaction versus Responsiveness to Calls and Ease of Communications. These will be explored further with Multiple Linear Regression.
Define, Measure, Analyze, Improve, Control
Simulate, Optimize, Realize
Web Demos
Our CTO and Co-Founder, John Noguera, regularly hosts free Web Demos featuring SigmaXL and DiscoverSim Click here to view some now!