Ensure that entire data table is selected. If not, check
Use Entire Data Table. Click Next.
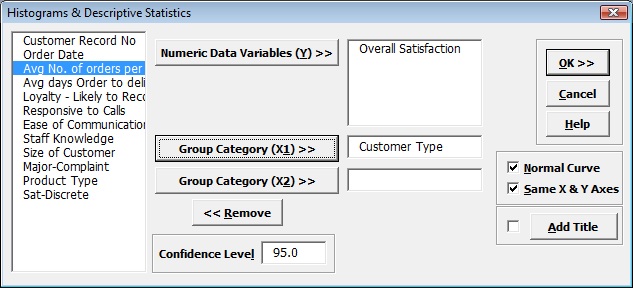
Select Overall Satisfaction, click
Numeric Data Variables (Y)
>>, select Customer Type, click Group Category (X1)
>> as shown:
Click OK. Multiple Histograms and Descriptive Statistics of Customer Satisfaction By Customer Type are produced:
Clearly Customer Type 2 shows a higher level of overall satisfaction, with the data skewed left. Note that Customer Type 1 and 3 have data that is normally distributed, but this is not desirable when the response is a satisfaction score!
Note that bin one is 1.72 to < 1.99, bin 2 is 1.99 to < 2.26, etc. The number of decimals displayed can be changed by double-clicking on the X axis, click Number tab, and adjust decimal places.
Define, Measure, Analyze, Improve, Control
Simulate, Optimize, Realize
Web Demos
Our CTO and Co-Founder, John Noguera, regularly hosts free Web Demos featuring SigmaXL and DiscoverSim Click here to view some now!


 Facebook
 LinkedIn
 YouTube