Chi-Square Test – Two-Way Table Data: Advanced Tests and Measures of Association –
Ordinal Categories
Checking the Ordinal Categories option provides statistics and measures of association appropriate when both row and column category variables are ordinal:
Adjusted Residuals and Cell’s Contribution to Chi-Square
Tests of Association for Ordinal Categories
Concordant – Discordant
The P-Value for this hypothesis test is from Kendall’s
Tau-B, but is the same for all of the Concordant –
Discordant ordinal measures: Tau-C, Gamma and Somers’ D.
See Agresti (2010). This may differ from other software
using an approximation formula.
Spearman Rank Correlation
Measures of Association for Ordinal Categories with
Confidence Intervals
Use Tau-B for square tables (no. rows = no. columns) and
Tau-C for rectangular tables (no. rows <> no. columns).
These are all Concordant – Discordant measures.
Somers' D (Cols & Rows Dependent, Symmetric)
Also a Concordant – Discordant measure but
directional. If the Y dependent variable is in the Rows
Category, then use the Rows Dependent measure. If the Y
dependent variable is in the Columns Category, then use
the Cols
Dependent measure. If there is no clear X-Y
dependent-independent relationship, then use the
Symmetric measure.
SigmaXL provides rules-of-thumb for Kendall’s
Correlation in Ordinal Attribute MSA (strong association is
> 0.8) and Pearson or Spearman Correlation (strong
association is > 0.9), however these are in the context of
measurement systems analysis, design of experiments or a
controlled process study. For typical contingency table
applications, we recommend the rules-of-thumb, adapted from
Cohen (1988):
0.5+: Strong (Large Effect)
0.3 to < 0.5: Moderate (Medium Effect)
0.1 to < 0.3: Weak (Small Effect)
< 0.1: Very Weak
Open the file Attribute Data.xlsx, click
Example 5 – Salary Sat Sheet tab. This data is in
two-way table format and has ordinal categories: Salary in the
Rows and Satisfaction Level in the Columns. Note that cells
A1:E5 have been pre-selected.
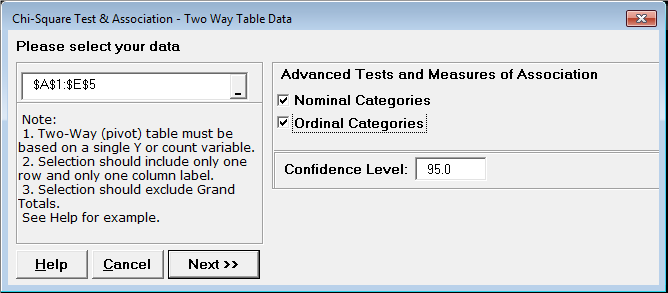
Click SigmaXL > Statistical Tools > Chi-Square Tests
> Chi-Square Test & Association – Two-Way Table Data.
Note the selection of data includes the Row and Column labels
(if we had Row and Column Totals these would NOT be selected).
Check Nominal Categories and Ordinal Categories
as shown:
Tip: Even if the categories are ordinal, it is
sometimes useful to select nominal categories as well for
comparison purposes.
Click Next. The resulting output is:
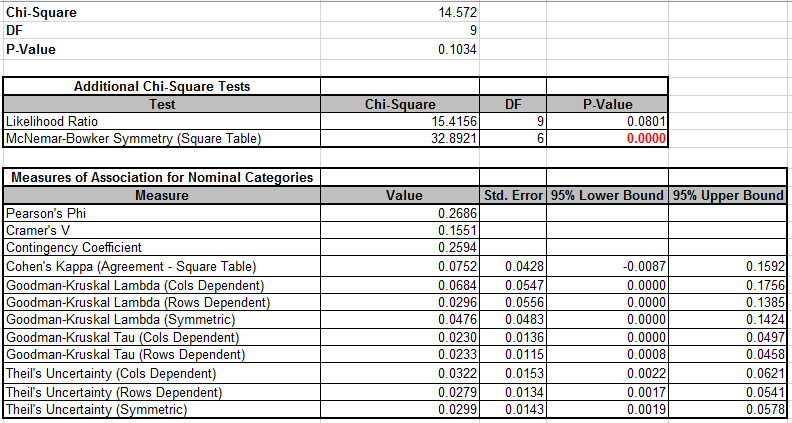
Note that the Chi-Square P-Value is 0.1, indicating that there
is no significant association between Salary and Satisfaction
when they are treated as nominal categories (although the
significant result for McNemar-Bowker does show that there is
lack of symmetry in the off diagonals).
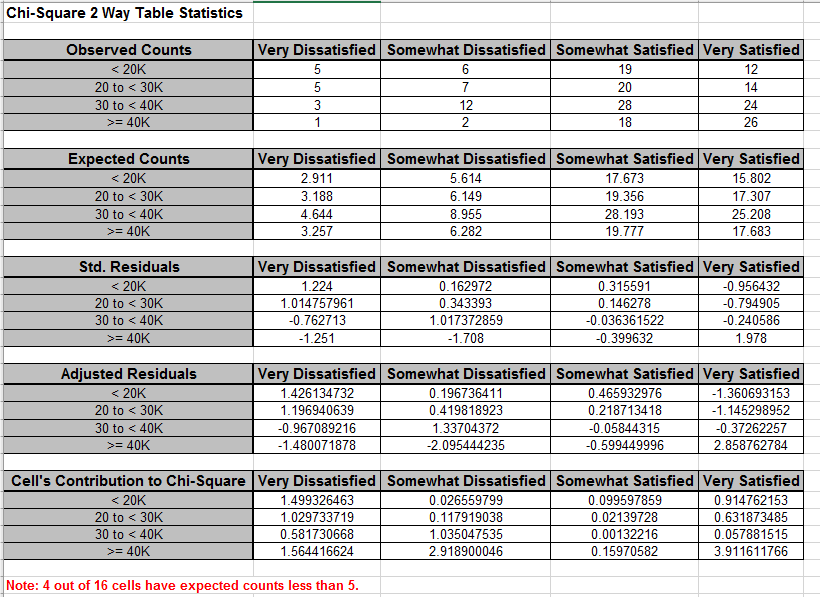
Since the Chi-Square P-Value is not significant, the Adjusted
Residuals are not highlighted, even though some values are
greater than 1.96 (and less than -1.96). This follows the
concept used in ANOVA called “Fisher Protected”
Note: 4 out of 16 cells have expected counts less than 5.
If more than 20% of the cells have expected counts less than 5
(or if any of the cells have an expected count less than 1), the
Chi-Square approximation may be invalid, and Fisher’s Exact
should be used. This will be discussed later, but for this
example the Fisher’s Monte-Carlo Exact P-Value = 0.095 so does
not change the interpretation of the results for the above
Chi-Square analysis.
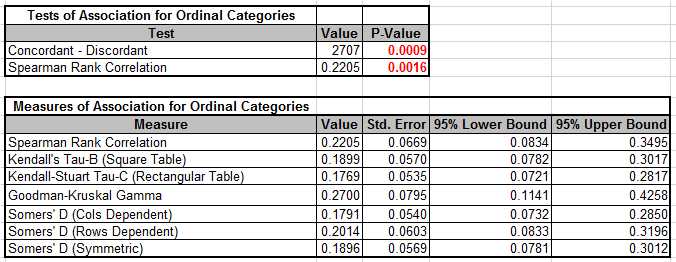
When Salary and Satisfaction are treated as ordinal categories,
the more powerful Concordant – Discordant and Spearman
Rank Correlation P-Values clearly show that there is a
significant association. The Measures of Association for
Ordinal Categories show that this is positive, i.e., an
increase in Salary is associated with an increase in
Satisfaction. However, using the rules-of-thumb given above, we
see that the association is weak.
The table row and column cell percentages can be visualized
using Excel’s 100% Stacked Column Chart. Select cells A3:E7 of
the Chi-Square sheet. Click Excel’s Insert > Insert
Column or Bar Chart and select 100% Stacked
Column as shown.
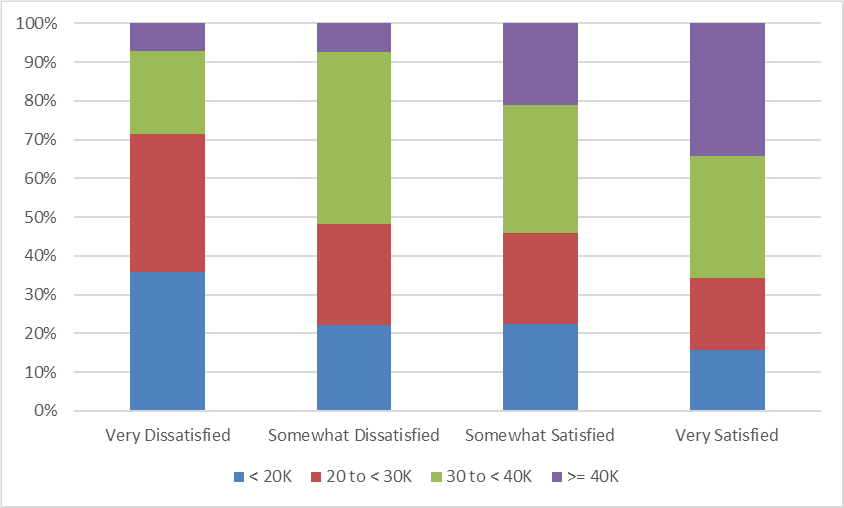
Click to create the 100% stacked column chart (uncheck the
Chart Title):
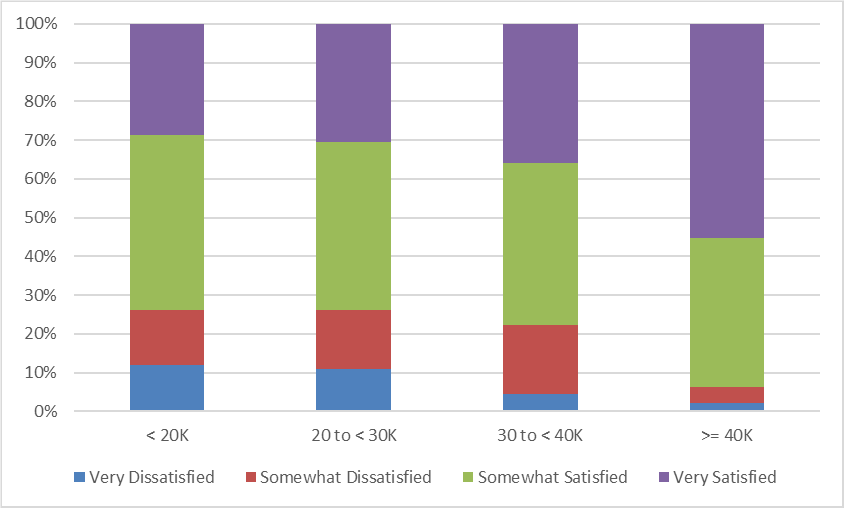
The rows and columns can easily be switched by clicking
Design > Switch Row/Column
Define, Measure, Analyze, Improve, Control
Simulate, Optimize, Realize
Web Demos
Our CTO and Co-Founder, John Noguera, regularly hosts free Web Demos featuring SigmaXL and DiscoverSim Click here to view some now!