How Do I Create a Scatter Plot Matrix in Excel Using SigmaXL?
Scatter Plot Matrix
Click Sheet 1 Tab of Customer Data.xlsx (or press
F4 to activate last worksheet). Click SigmaXL > Graphical
Tools > Scatter Plot Matrix.
Ensure that entire data table is selected. If not, check
Use Entire Data Table. Click Next.
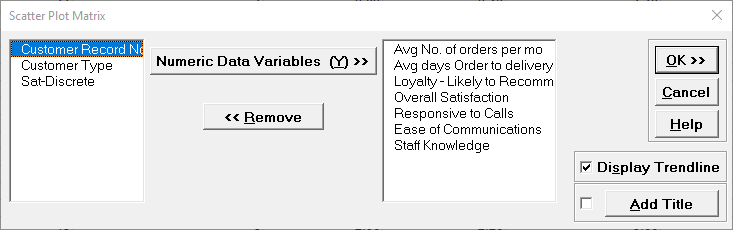
Select the variable Avg No. of orders per month; shift-click on
Staff Knowledge and click Numeric Data Variables (Y) >>
as shown:
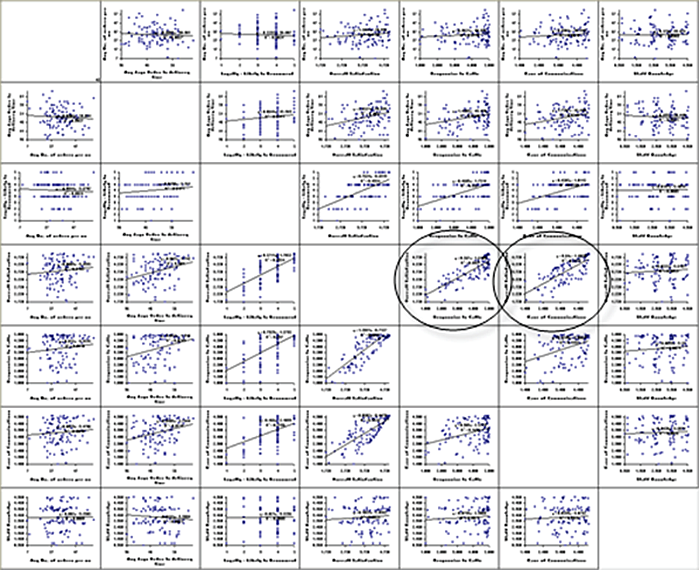
Click OK. Resulting Scatter Plot Matrix:
Of particular interest is Overall Satisfaction versus Responsiveness to Calls and Ease of Communications. These are explored further with Multiple Linear Regression.