Interaction Plots
The Interaction Plots demonstrated in the Two-Way ANOVA
example are also available as a standalone graphical tool.
- Open Customer Data.xlsx,click on sheet 1 tab (or press
F4 to activate last worksheet).
- Click SigmaXL > Graphical Tools > Interaction Plot Ensure that
the entire data table is selected.
If not, check Use Entire Data Table.
- Click Next.
Select Avg No of Orders per Mo, Click Numeric Data Variable (Y)
>>; select Customer Type, click Group Category
Factor (X1) >>; select Size of Customer, click Group
Category Factor (X2) >>.
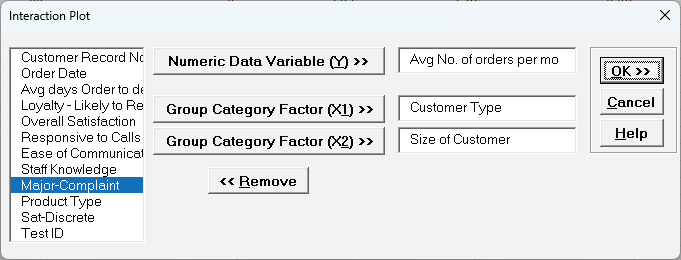
- Click OK.
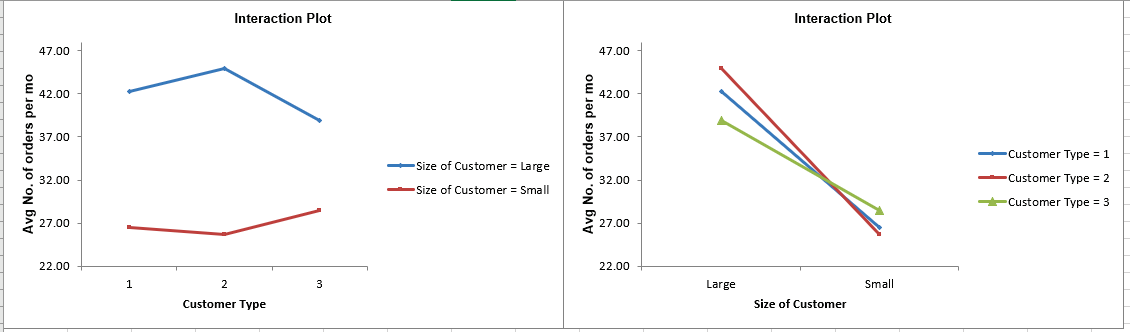
The mean values shown are fitted means From a Two - Way ANOVA, not data means.


