Power & Sample Size for 2 Sample t-Test
To determine Power & Sample Size for a 2 Sample t-Test, you can use the Power & Sample Size Calculator or Power & Sample Size with Worksheet.
- Click SigmaXL > Statistical Tools > Power & Sample Size Calculators > 2 Sample t-Test Calculator.
- Select Solve For Power (1 – Beta). Enter Sample Size and Difference as shown:
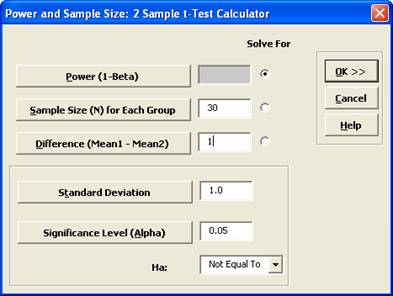
Note that we are calculating the power or likelihood of detection given that Mean1 – Mean2 = 1, with sample size for each group = 30, standard deviation = 1, significance level = .05, and Ha:
Not Equal To (two-sided test).
- Click OK. The resulting report is displayed:
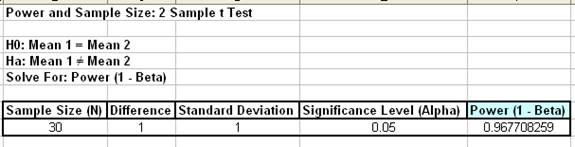
A power value of 0.97 is good, hence we have the basis for the “minimum sample size n=30” rule of thumb used for continuous data.
- To determine Power & Sample Size using a Worksheet, click SigmaXL > Statistical Tools > Power & Sample Size with Worksheet > 2 Sample t-Test.
- A graph showing the relationship between Power, Sample Size and Difference can then be created using SigmaXL > Statistical Tools > Power & Sample Size Chart.
See here for an example using the 1 Sample t-Test.


