Basic Statistical Templates One-Way Chi-Square Goodness-of-Fit Test -
Exact Example
Click SigmaXL > Templates & Calculators > Basic Statistical Templates > One-Way
Chi-Square Goodness-of-Fit Test - Exact to access the One Way Chi-Square
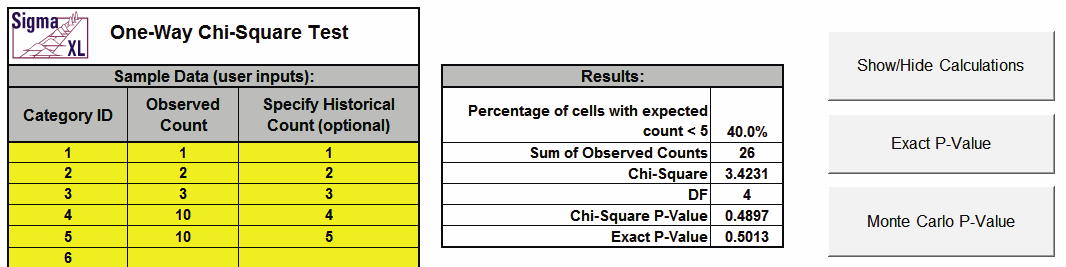
Goodness-of-Fit Test Exact calculator. The template gives the following default example.
Notes
- Enter Category ID, Observed Count values and (optional) Historical
Counts. Do not modify any other part of this worksheet.
- If optional historical counts are not specified, chi-square is calculated using equal
expected proportions.
- If optional Historical Counts are specified, a value must be entered for each observed
count.
- The Chi-Square statistic requires that no more than 20% of cells have an
expected count less than 5 (and none of the cells have an expected count
less than 1). If this assumption is not satisfied, the Chi-Square
approximation may be invalid and Exact or Monte Carlo P-Values should be
used. In this example 40% of the cells have an expected count less than 5 so
Exact should be used.
- This example shows that the Exact P-Value is 0.5013 and the large
sample Chi-Square P-Value is 0.4897.
- Chi-Square Exact solves the permutation problem using enhanced
enumeration. For further details refer to the Appendix
Exact and Monte Carlo P-Values for Nonparametric and Contingency Test.
- It is important to note that while exact P-Values are correct,
they do not increase (or decrease) the power of a small sample test, so
they are not a solution to the problem of failure to reject the null due
to inadequate sample size.
- For data that requires more computation time than specified, Monte
Carlo P-Values provide an approximate (but unbiased) P-Value that
typically matches exact to two decimal places using 10,000 replications.
One million replications give a P-Value that is typically accurate to
three decimal places. A confidence interval (99% default) is given for
the Monte Carlo P-Values.
Monte-Carlo Example
- The Exact P-Value for this example is solved very
quickly, so Monte Carlo is not needed, but we will run it for continuity in
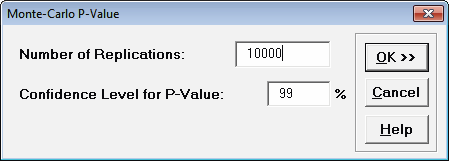
the example. Click Monte Carlo P-Value. Select Number of
Replications =
10000 and Confidence Level for P-Value = 99%.
- Click OK. Results
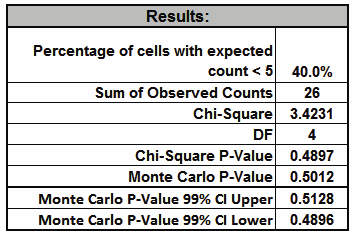
The Monte Carlo P-Value here is
0.5012 with a 99% confidence interval of 0.4896 to 0.5128. This will
be slightly different every time it is run (the Monte Carlo seed
value is derived from the system clock). The true Exact P-Value =
0.5013 lies within this confidence interval.
Small Sample Exact Sample
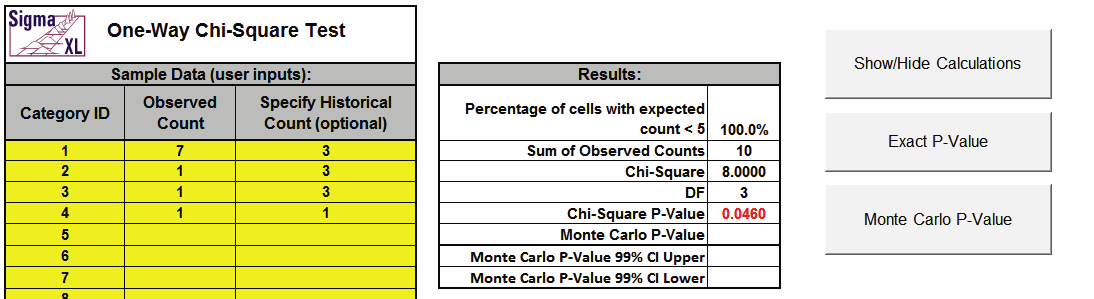
- Now we will consider a small sample problem. Enter
the following values for sample data in the yellow highlight region. Note
that the displayed Monte Carlo (or Exact) P-Values are cleared when new data
is entered in the template:
This example is adapted from Mehta, C.R. and Patel, N. R., IBM SPSS Exact Tests, IBM Corp., page 44.
- Click Exact P-Value. Select
Time Limit for Exact
Computation = 60 seconds.
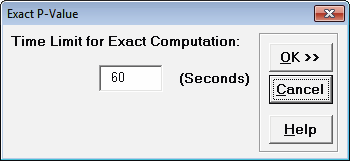
- Click OK. Results:
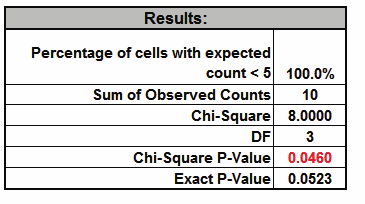
Note that the Exact P-Value is 0.0523 which is a fail-to-reject
of the null hypothesis (H0), but the large sample or asymptotic
Chi-Square P-Value incorrectly rejected H0 with a P-Value of 0.046.
The exact P-Value matches that given in the reference. The error can
also go the other way, where a large sample Chi-Square P-Value is a
fail-to-reject of the null hypothesis and the Exact P-Value is a
rejection of H0. In conclusion, always use the Exact (or Monte Carlo) P-Value when
the Chi-Square large sample assumptions are not met.


