Include Top

Friedman Test

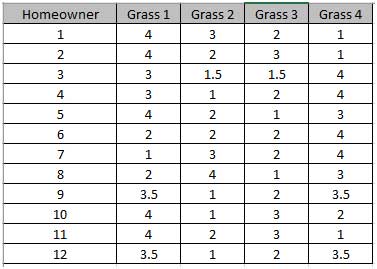
The Friedman test is an extension of the Wilcoxon Signed-Rank test and the nonparametric equivalent of a One-Way Repeated-Measures ANOVA(i.e., One-Way ANOVA on Within Subject Ranks). The concept is the same as that of the Paired t-test, we are interested in the within subject variability, not the subject-to-subject variability.

It can also be considered as a nonparametric alternative to a DOE model with blocks or GLM with one fixed factor and one random factor. The Friedman test requires exactly 1 non-missing observation for each level of the treatment, within each block.

The null and alternative hypothesis are:

H0: Median 1 = Median 2 = ... = Median k (apart from Subject/Block Effect)
Ha: At least one pair Median i ≠ Median j (apart from Subject/Block Effect)

  1. Open Conover Grass Type Experiment.xlsx, click on Sheet 1 tab. This data is from: Conover, W.J. (1999), Practical Nonparametric Statistics (3rd Edition). New York: John Wiley & Sons, pp. 371-373, Example 1. Twelve homeowners are randomly selected to participate in an experiment with a plant nursery. Each homeowner was asked to select four fairly identical areas in their yard and to plant four different types of grass, one in each area. At the end of a specified length of time each homeowner was asked to rank the grass types in order of preference. The data are given in tabular format (unstacked):

    friedmanstep1

  2. Click SigmaXL > Statistical Tools > Nonparametric Tests > Friedman Test. Ensure that the entire data table is selected. If not, check Use Entire Data Table.

  3. Click Next. Ensure that Subgroups across Rows (2 or More Numeric Data Columns same Subject for each Row) is selected. Select Grass 1 to Grass 4, click Numeric Data Variables (Y) >>.

    friedmanteststep3

  4. Click OK. The results are shown below:

    friedmanstep4

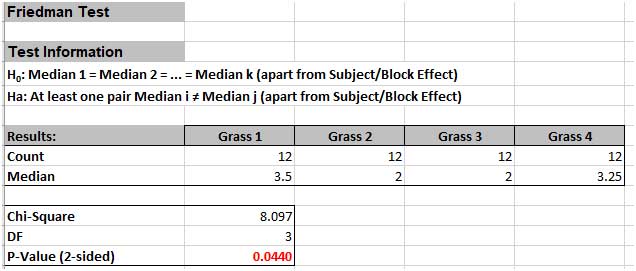
    The P-Value of 0.044 tells us that we reject H0. At least one pairwise set of medians are not equal, so there is a difference in the preference of grass types(i.e., there is a difference in treatment effects).

Friedman Test - Exact

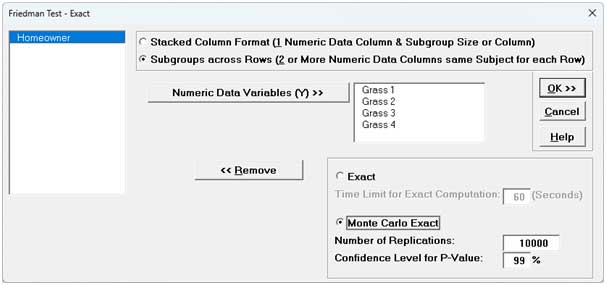
We will now redo the above example to estimate the exact P-Value using Monte Carlo. Typically, this would not be necessary unless the sample sizes were smaller (N subjects <=5 ), but this gives us continuity on the example.

  1. Open Conover Grass Type Experiment.xlsx, click on Sheet 1 tab (or press F4 to activate last worksheet).

  2. Click SigmaXL > Statistical Tools > Nonparametric Tests - Exact > Friedman Test - Exact. If necessary, check Use Entire Data Table, click Next.

  3. Ensure that Subgroups across Rows (2 or More Numeric Data Columns same Subject for each Row) is selected. Select Grass 1 to Grass 4, click Numeric Data Variables (Y) >>. Select Monte Carlo Exact with the Number of Replications = 10000 and Confidence Level for P-Value = 99%.

    friedmanteststep3

    Tip: The Monte Carlo 99% confidence interval for P-Value is not the same as a confidence interval on the test statistic due to data sampling error. The confidence level for the hypothesis test statistic is still 95%, so all reported P-Values less than .05 will be highlighted in red to indicate significance. The 99% Monte Carlo P-Value confidence interval is due to the uncertainty in Monte Carlo sampling, and it becomes smaller as the number of replications increases (irrespective of the data sample size). The Exact P-Value will lie within the stated Monte Carlo confidence interval 99% of the time.

  4. Click OK.

    friedmanteststep4

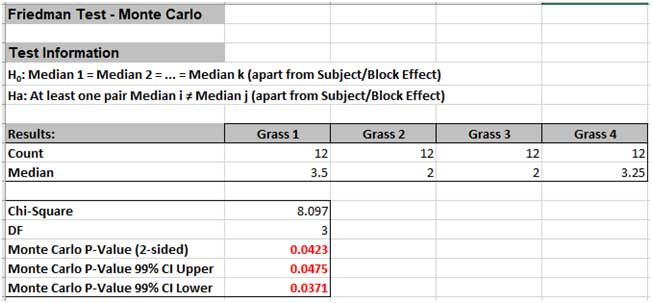
    The Monte Carlo P-Value is 0.0475 with a 99% confidence interval of 0.0371 to 0.0475. This will be slightly different every time it is run (the Monte Carlo seed value is derived from the system clock). So, we reject H0: at least one pairwise set of medians are not equal, i.e., there is a difference in the preference of grass types (or there is a difference in treatment effects).

    Note that the large sample (asymptotic) P-Value of 0.044 also lies within the Monte Carlo exact confidence interval.


Define, Measure, Analyze, Improve, Control

Lean Six Sigma Software Excel Add-in

Simulate, Optimize,
Realize

Lean Six Sigma Software Excel Add-in

Web Demos

Our CTO and Co-Founder, John Noguera, regularly hosts free Web Demos featuring SigmaXL and DiscoverSim
Click here to view some now!

Contact Us

Phone: 1.888.SigmaXL (744.6295)

Support: Support@SigmaXL.com

Sales: Sales@SigmaXL.com

Information: Information@SigmaXL.com