Chi-Square Test
Two Way Table Data
Fishers Exact
- Home /
- Chi-Square 2-Way Data Table – Fishers Exact

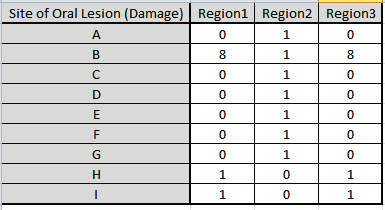
Now we will consider a sparse data set where the Chi-Square approximation fails and Fishers Exact is required to give a correct conclusion for the hypothesis test. This is adapted from a subset of dental health data (oral lesions) obtained from house to house surveys that were conducted in three geographic regions of rural India [1, 2]. The Fishers Exact P-Value obtained with SigmaXL may be validated using these references. The data labels have been modified to a generic A, B, C, etc. for the oral lesions location (rows) and Region1, Region2 and Region3 for the geographic regions (columns).
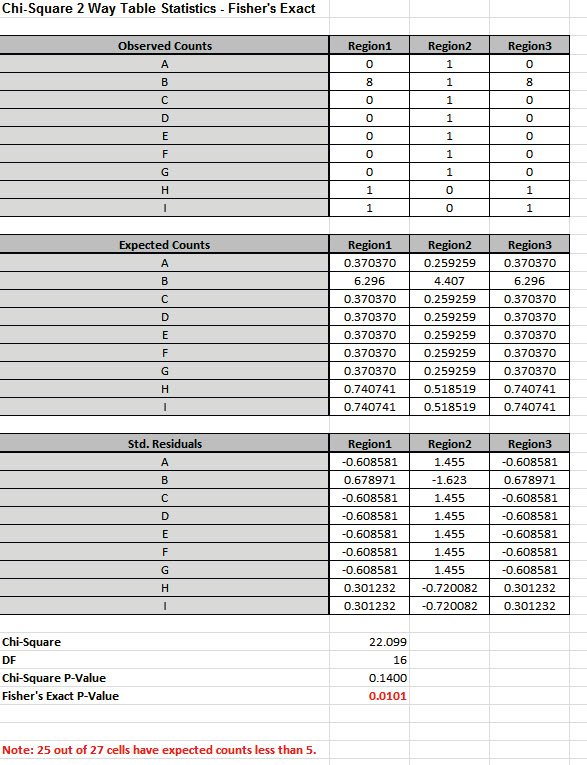
Note: 25 out of 27 cells have expected counts less than 5.
Since more than 20% of the cells have expected counts less than 5
and several cells have an expected count less than 1, the Chi-Square
P-Value = 0.14 is invalid and leads to an incorrect conclusion: Fail
to Reject H0, Site of Oral Lesion and Geographic Region are
independent. However, with Fishers Exact P-Value = 0.0101, we have
strong evidence to reject H0, and conclude that there is indeed a
relationship between Site of Oral Lesion and Region.
While this example is originally from a dental health study, it could have been Defect Type versus Supplier and highlights that the use of Fishers Exact for contingency tables with sparse data can make the difference between a good business decision and a bad business decision!
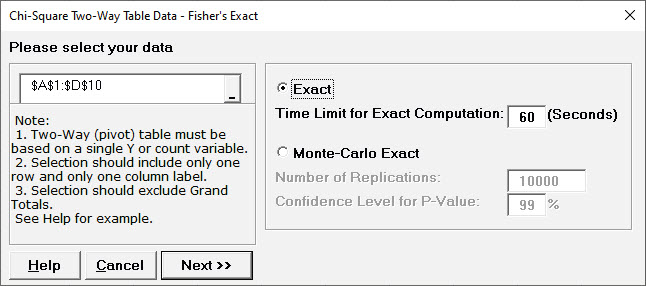
The Exact P-Value was computed very quickly, but if the data set
was larger, the required computation time could become
excessive, and Monte Carlo would be required. We will rerun this
analysis with Monte Carlo and discuss the output report.
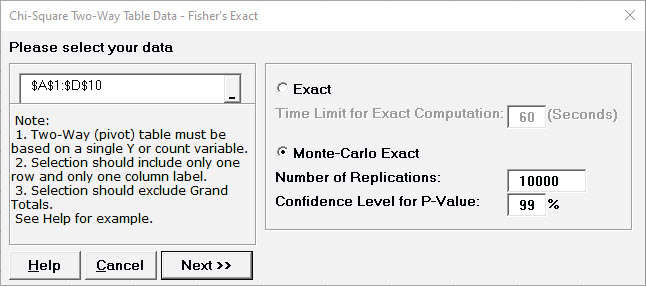
Tip: As discussed above 10,000 replications will result in a Monte Carlo P-Value that is correct to two decimal places. One million (1e6) replications will result in three decimal places of accuracy and typically require less than 60 seconds to solve for any data set.
Tip: The Monte Carlo 99% confidence interval for P-Value is not the same as a confidence interval on the test statistic due to data sampling error. The confidence level for the hypothesis test statistic is still 95%, so all reported P-Values less than .05 will be highlighted in red to indicate significance. The 99% Monte Carlo P-Value confidence interval is due to the uncertainty in Monte Carlo sampling, and it becomes smaller as the number of replications increases (irrespective of the data sample size). The Exact P-Value will lie within the stated Monte Carlo confidence interval 99% of the time.
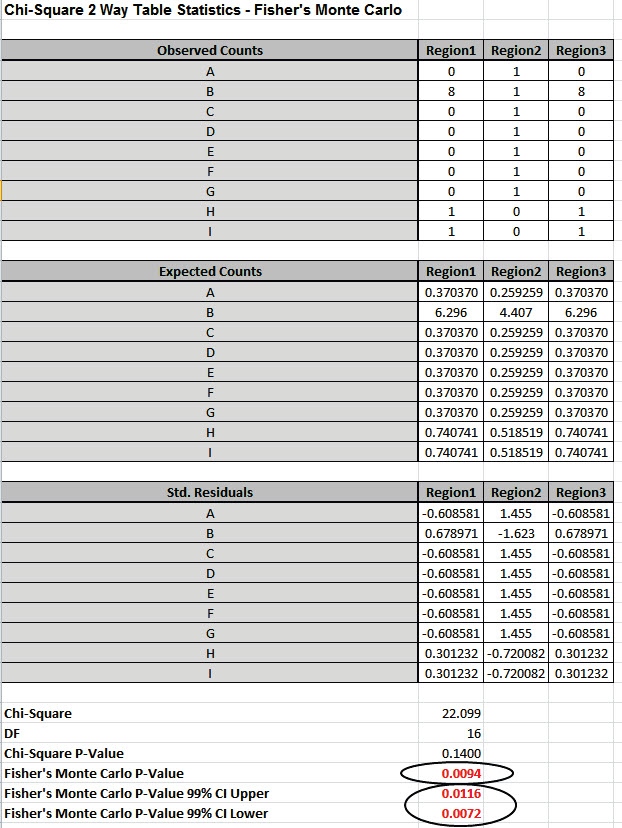
Fishers Monte Carlo P-Value here is 0.0094 with a 99% confidence interval of 0.0072 to 0.0116. This will be slightly different every time it is run (the Monte Carlo seed value is derived from the system clock). The true Exact P-Value = 0.0101 lies within this confidence interval. If the confidence interval is too wide (e.g., upper is a fail-to-reject H0 and lower is a reject H0), simply rerun the Monte Carlo option using a larger number of replications (use 1e5 or 1e6).
[1] Mehta, C. R.; Patel, N. R. (1997) "Exact inference in
categorical data," unpublished preprint. See Table 7 (p. 33) for
validation of Fishers Exact P-Value.
[2] Mehta, C.R. ; Patel, N.R. (1998). "Exact Inference for
Categorical Data." In P. Armitage and T. Colton, eds., Encyclopedia
of Biostatistics, Chichester: John Wiley, pp. 14111422.


