X-Bar & S Charts
- Home /
- X-Bar & S Charts

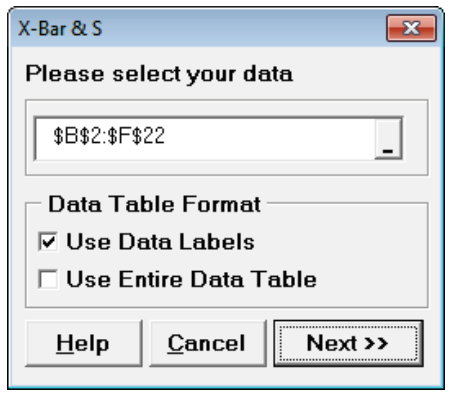
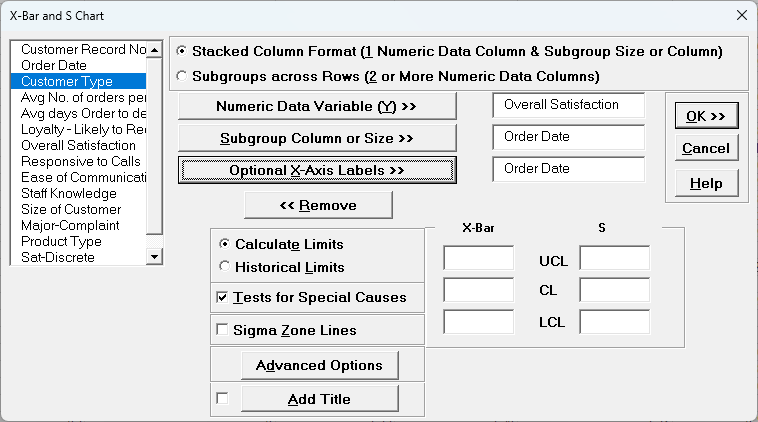
 as shown:
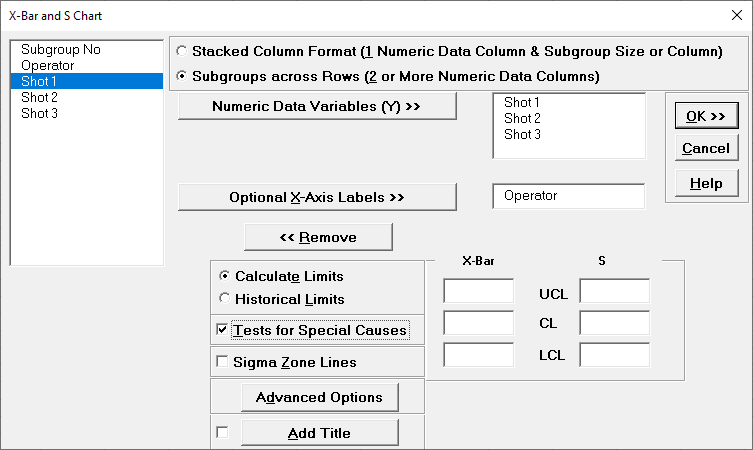
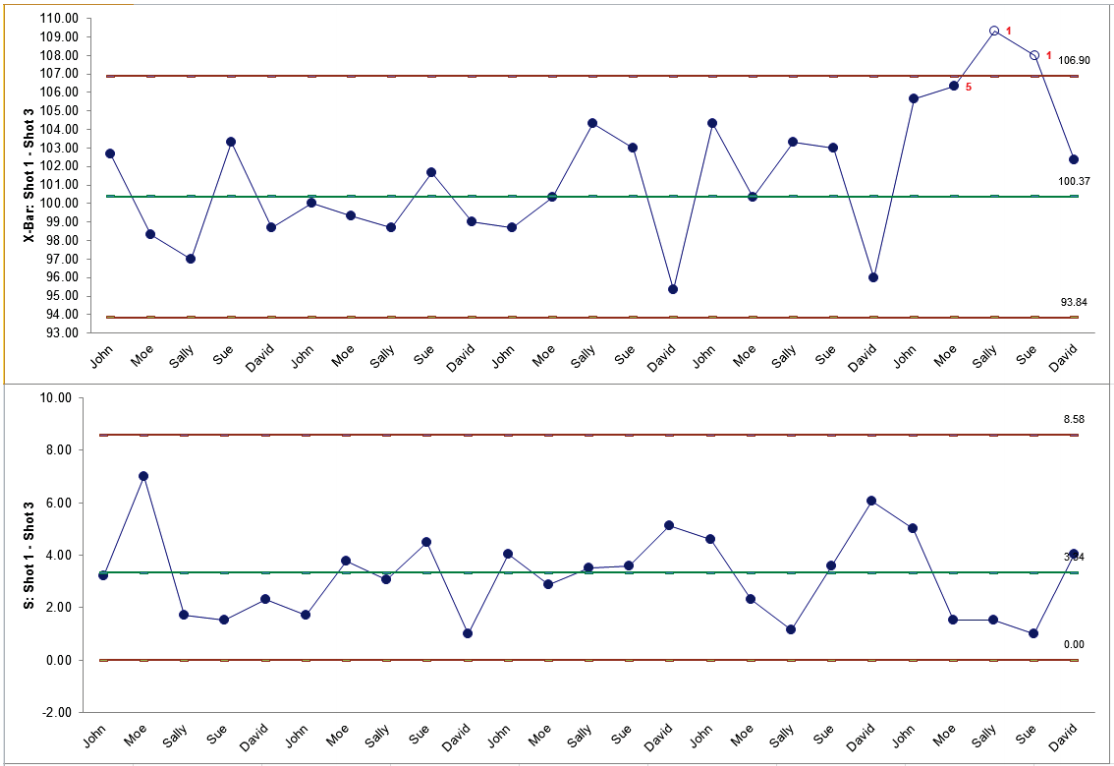
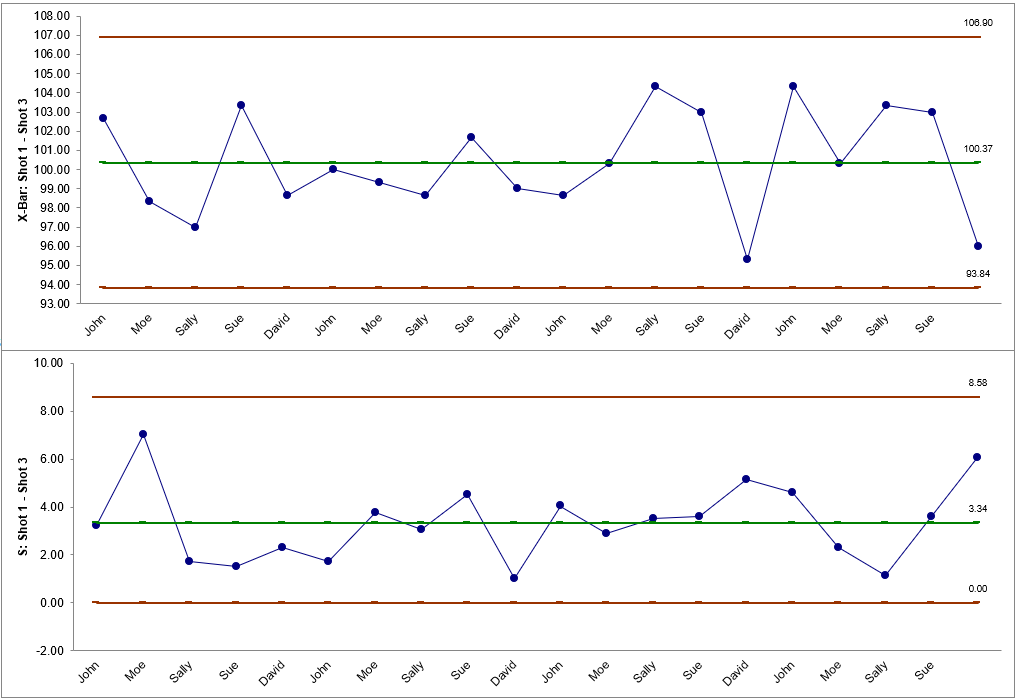
Note: Subgroups are always displayed in the same order as given in the rows. They are not sorted by Order Date.
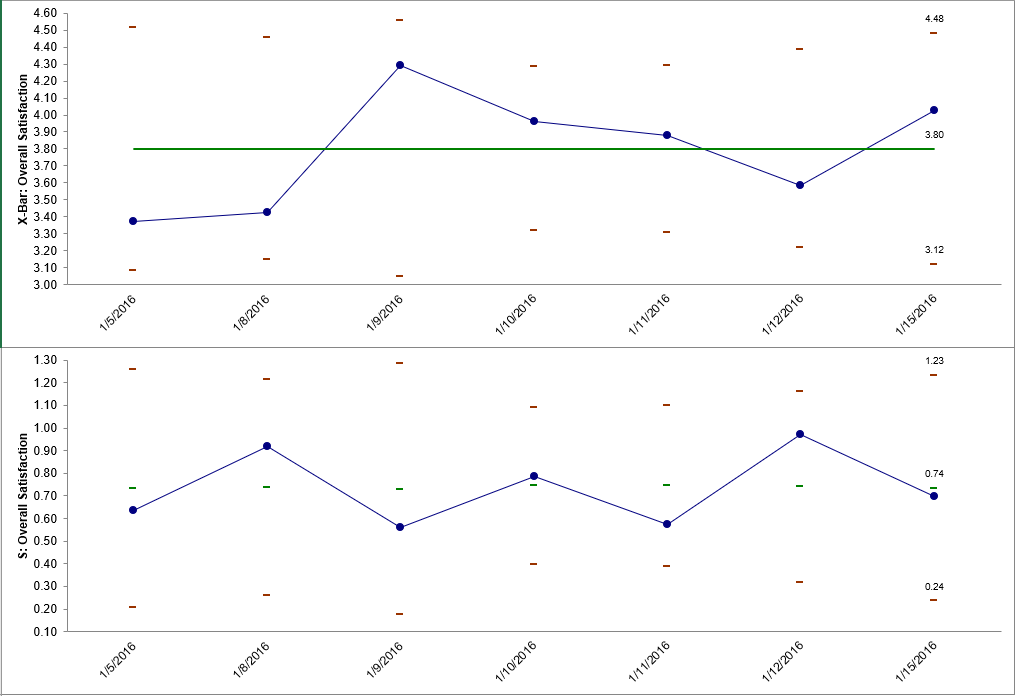
The moving limits are due to the varying subgroup sizes. This appears to be a stable process, but typically one would want a minimum of 20 subgroups when creating a control chart. This example is for demonstration purposes only.


