Include Top

How Do I Create U-Charts in Excel Using SigmaXL?

U-Charts

  1. Open Attribute Data U Chart Defects.xlsx.  U Charts (for Defects) can have fixed or varying subgroup sizes.
  2. Select SigmaXL > Control Charts > Attribute Charts> U. Ensure that the entire data table is selected. If not, check Use Entire Data Table. Click Next.
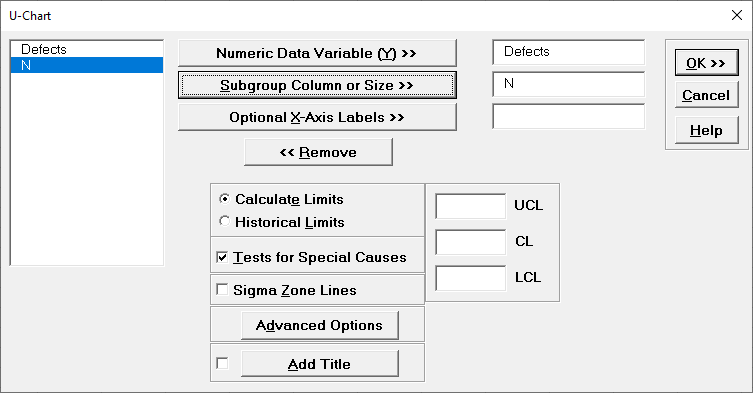
  3. Select Defects, click Numeric Data Variable (Y) >>. Select N, click Subgroup Column or Size >>.  Check Tests for Special Causes.


    SigmaXL u-Chart Options


  4. Click OK. The resulting U-Chart is shown:

  5. nP-Chart in Excel

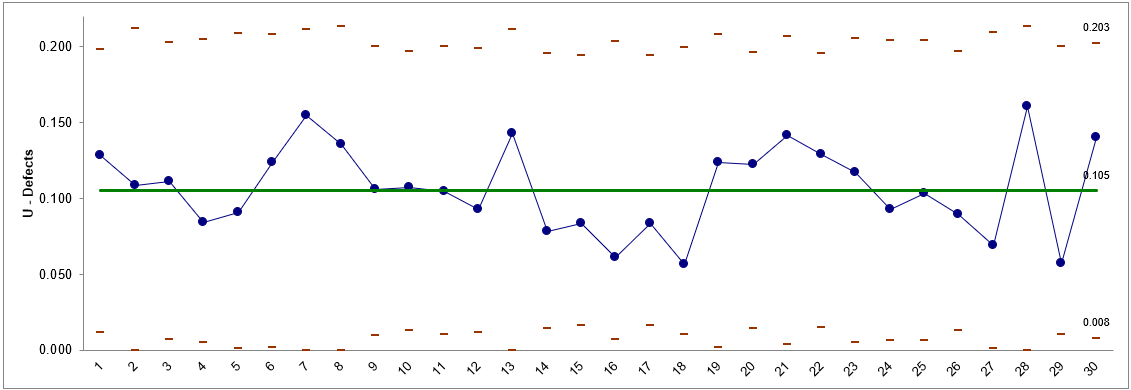
    This is a stable process, with no tests for special causes flagged.

Define, Measure, Analyze, Improve, Control

Lean Six Sigma Software Excel Add-in

Simulate, Optimize,
Realize

Lean Six Sigma Software Excel Add-in

Web Demos

Our CTO and Co-Founder, John Noguera, regularly hosts free Web Demos featuring SigmaXL and DiscoverSim
Click here to view some now!

Contact Us

Phone: 1.888.SigmaXL (744.6295)

Support: Support@SigmaXL.com

Sales: Sales@SigmaXL.com

Information: Information@SigmaXL.com