- LIVE HELP IS

Overlay Multiple Histograms (Overlay Histograms & Descriptive Statistics)
- Click Sheet 1 tab of Customer Data.xlsx (or press F4 to activate last worksheet).
- Click SigmaXL > Graphical Tools > Overlay Histograms & Descriptive Statistics.
- Ensure that entire data table is selected. If not, check Use Entire Data Table. Click Next.
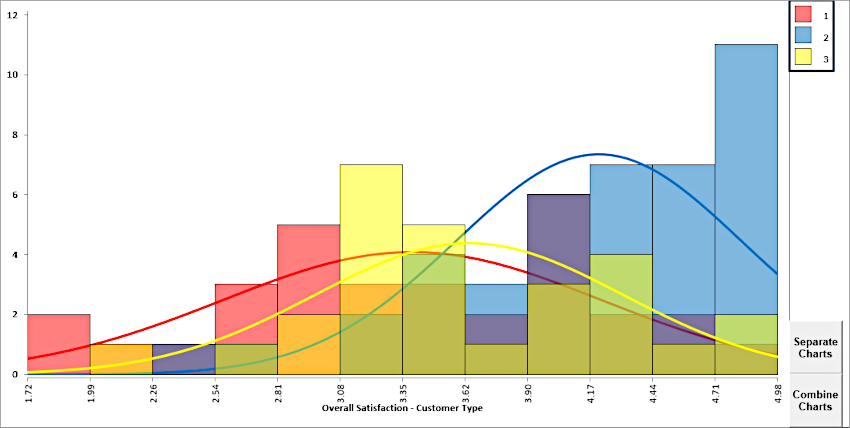
- Select Overall Satisfaction, click Numeric Data Variables (Y) >>, select Customer Type, click Group Category (X1) >> as shown:

Note: A maximum of 5 Numeric Data Variables or 5 Group Category levels are permitted. We recommend using this to compare 2 or at most 3 variables/levels. - Click OK. Overlay Multiple Histograms and Descriptive Statistics of Customer Satisfaction By Customer Type are produced:
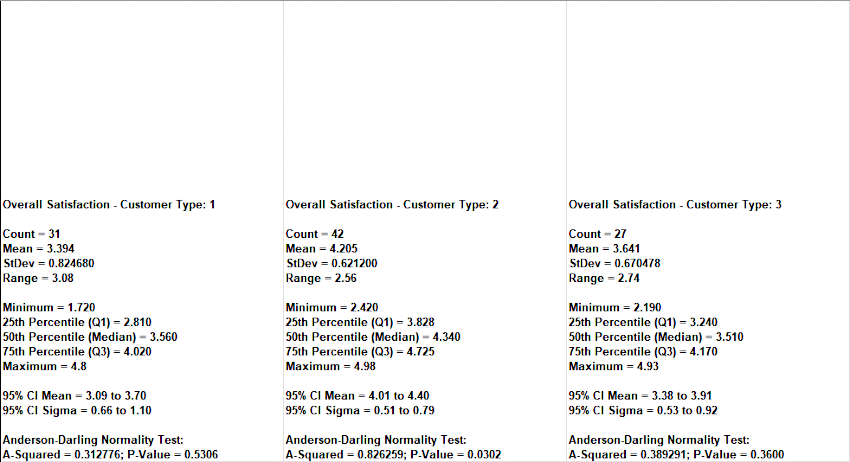
The Histograms and Descriptive Statistics can be separated and combined. Colors and Transparency levels can be adjusted using Excel's Format Chart Area tool. - Open the file Catapult Data-Before After Improvement.xlsx.
- Click SigmaXL > Graphical Tools > Overlay Histograms & Descriptive Statistics.
- Ensure that entire data table is selected. If not, check Use Entire Data Table. Click Next
- Select Distance, click Numeric Data Variables (Y) >>, select Before_After, click Group Category (X1) >> as shown:

- Click OK. Overlay Multiple Histograms and Descriptive Statistics of Distance by Before/After Improvement are produced:
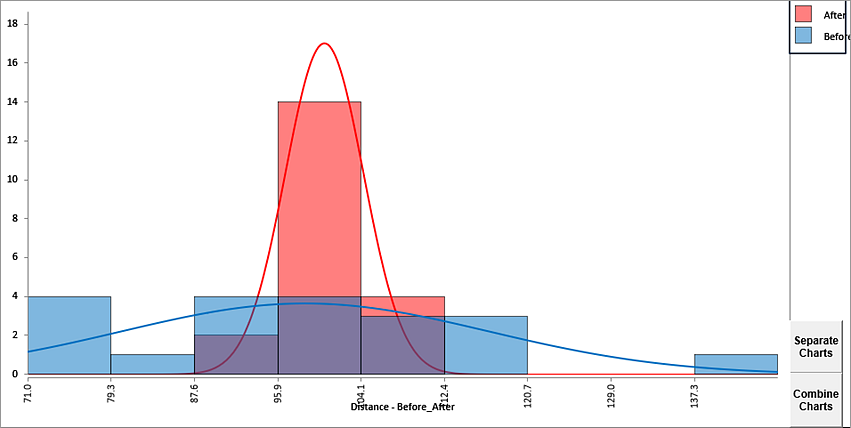
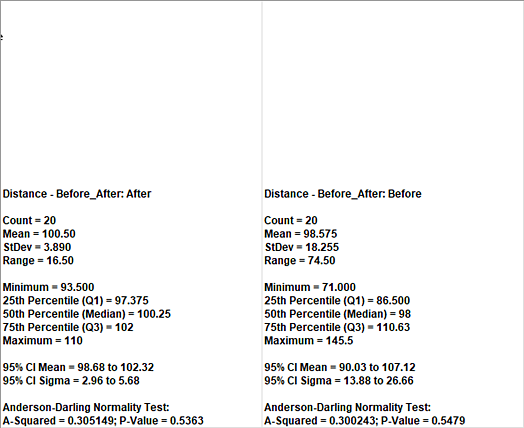
As previously noted, Histograms and Descriptive Statistics can be separated and combined. This is a useful graphical complement to any two-sample statistical test.
Define, Measure, Analyze, Improve, Control


Simulate, Optimize,
Realize

Web Demos
Our CTO and Co-Founder, John Noguera, regularly hosts free Web Demos featuring SigmaXL and DiscoverSim
Click here to view some now!
Contact Us
Phone: 1.888.SigmaXL (744.6295)
Support: Support@SigmaXL.com
Sales: Sales@SigmaXL.com
Information: Information@SigmaXL.com
 Facebook
 LinkedIn
 YouTube
Copyright © 2002 - SigmaXL | Privacy Policy & Legal Notices | Terms & Conditions