Basic Statistical Templates One-Way Chi-Square Goodness-of-Fit Test
This tool is used to calculate exact P-Values. Typically this would not be necessary unless
the sample sizes were smaller (N <= 15 for Wilcoxon), but this gives continuity on the
example.
Open Customer Data.xlsx, select Sheet 1 tab
(or press F4 to activate last worksheet). Click SigmaXL
> Statistical Tools > Nonparametric Tests Exact > 1 Sample
Wilcoxon - Exact. If necessary, check Use
Entire Data Table, click Next.
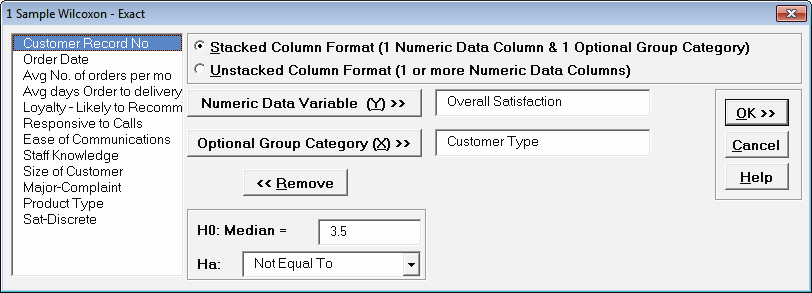
Ensure that Stacked Column Format is
selected. Select
Overall Satisfaction, click Numeric Data Variable (Y)
>>; select
Customer Type, click Optional Group Category (X)
>>.
Enter 3.5 for the Null Hypothesis H0:
Median value. Set
Ha as Not Equal To.
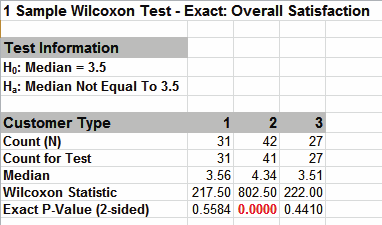
Click OK. Results:
The Wilcoxon Statistics are identical to the
above large
sample or asymptotic results. The Exact P-Values are close
but slightly different. This was expected because the sample
sizes are reasonable (N > 15), so the large sample P-Values
are valid using a normal approximation for the Wilcoxon
Statistic.
Note, if Count (N) is greater than 1000, the Exact
P-Value is
estimated using a continuity -corrected normal approximation.
Since the Wilcoxon Exact P-Value is computed very quickly for
sample sizes as large as 1000, Monte Carlo P-Values are not
required.
Now we will consider a small
sample problem. Open Nonnormal Task Time Difference Small
Sample.xlsx. A study was performed to determine the
effectiveness of training to reduce the time required to
complete a short but repetitive process task. Fifteen operators
were randomly selected and the difference in task time was
recorded in seconds (after training before training). A
negative value denotes that the operator completed the task in
less time after training than before.
Click SigmaXL > Graphical Tools > Histograms &
Descriptive Statistics. If necessary, check Use
Entire Data Table. Click Next. Select
Difference (Seconds), click Numeric Data
Variables (Y) >>. Click OK.
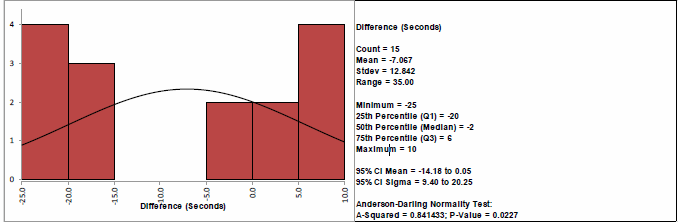
This small sample data fails the Anderson Darling
Normality Test (P-Value = .023). Note that this is due to the
data being uniform or possibly bimodal, not due to a skewed
distribution. Now we will perform a 1 Sample t-Test and review
the assumptions.
Select Task
Time Difference tab (or press F4 to
activate last worksheet). Click SigmaXL > Statistical
Tools > 1 Sample t-Test & Confidence Intervals. If
necessary, check Use Entire Data Table, click
Next.
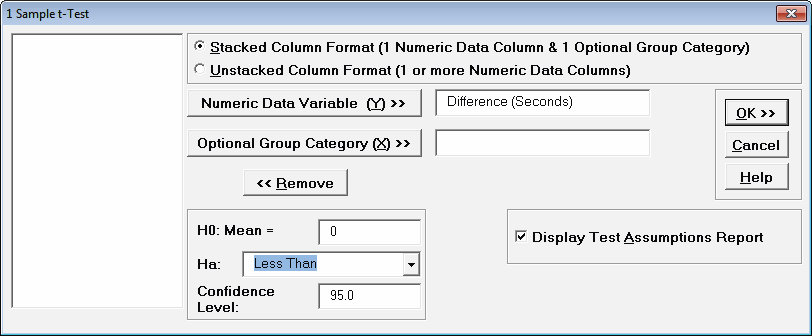
Ensure that
Stacked Column Format is selected. Select
Difference (Seconds), click Numeric Data Variable (Y)
>>.
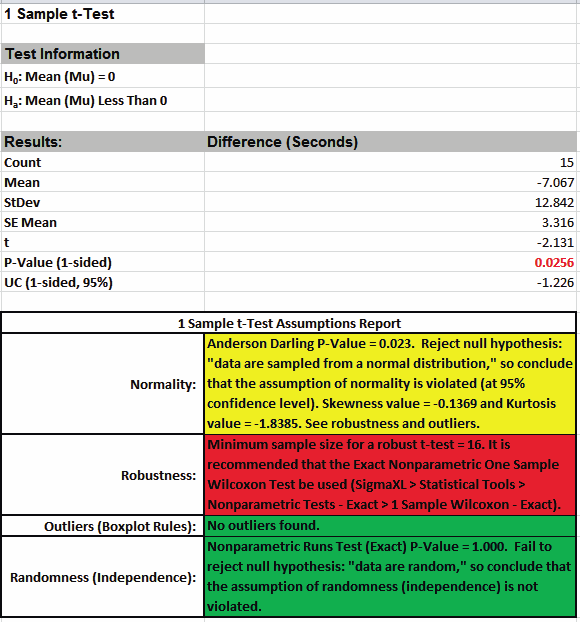
This is a one sided test because we have no reason to expect
that the task time will increase, so the Null Hypothesis H0: μ =
0; and the Alternative Hypothesis Ha: μ < 0. Enter 0 for the
Null Hypothesis H0: Mean value. Select
Ha as Less Than, Confidence Level =
95.0%, and check Display Test Assumptions Report.
Click OK.
The 1 Sample t-Test Assumptions Report
highlights that the data are not normal, but note that Kurtosis
equal to -1.84 is the issue here, not Skewness. This was
observed in the Histogram above with the data being uniform or
possibly bimodal.
The sample size is too small for a robust t-Test, so the Exact
One Sample Wilcoxon Test is recommended. The Wilcoxon Test is
recommended over the Sign Test because it is a more powerful
test and meets the requirement that the data be symmetrical. The
Exact test is recommended because the sample size is very small
(N <= 15).
Select Task Time Difference tab (or press
F4 to activate last worksheet). Click
SigmaXL > Statistical Tools > Nonparametric Tests Exact > 1
Sample Wilcoxon - Exact. If necessary, check
Use Entire Data Table, click Next.
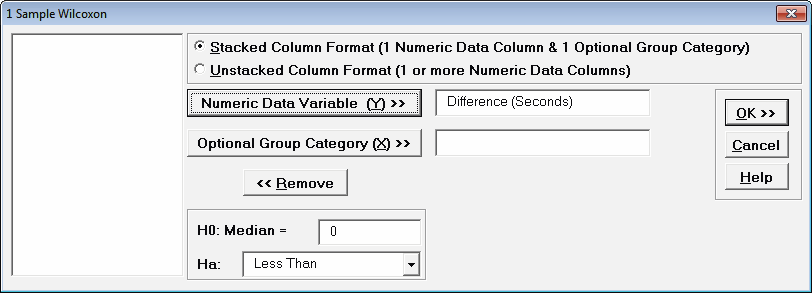
Ensure that Stacked Column Format is selected.
Select Difference (Seconds), click Numeric Data Variable
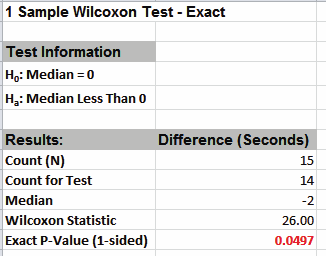
(Y) >>. Enter 0 for the Null Hypothesis
H0:Median value. Select Ha as Less
Than.
Click OK. Results:
With the P-Value = .0497 we reject H0 and conclude that the
Median Task Time Difference is significantly less than 0, so the
training is effective.By way of comparison we will now rerun the analysis using
the
large sample (asymptotic) Wilcoxon test.
Select Task Time Difference tab (or press
F4 to activate last worksheet). Click
SigmaXL > Statistical Tools > Nonparametric Tests > 1 Sample
Wilcoxon. If necessary, check Use Entire Data
Table, click Next.
Ensure that Stacked Column Format is selected.
Select Difference (Seconds), click Numeric Data Variable
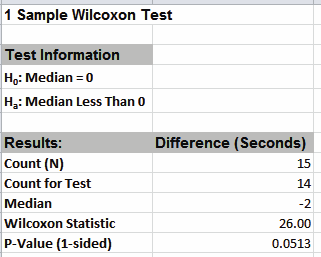
(Y) >>. Enter 0 for the Null Hypothesis
H0:Median value. Select Ha as Less
Than.
Click OK. Results:
Now with the P-Value = .0513 we incorrectly fail to reject H0.
The difference between exact and large sample P-Value is small
but it was enough to lead us to falsely conclude that the
training is ineffective.
In conclusion, whenever you have a small sample size and are
performing a Nonparametric test, always use the Exact option.