One Sample Sign & Wilcoxon Signed Rank Tests in Excel Using SigmaXL
One Sample Sign Test
The sign test is the simplest of the nonparametric tests, and is similar to testing if a
two-sided coin is fair. Count the number of positive values (larger than hypothesized
median), the number of negative values (smaller than the hypothesized median), and test
whether there are significantly more positives (or negatives) than expected. The One Sample
Sign Test is a nonparametric equivalent to the parametric One Sample t-Test.
Historically, our Median customer satisfaction score has been 3.5. We would like to see if
this has changed, with the results grouped by customer type (H0: Median = 3.5, Ha: Median ≠ 3.5,
α = 0.05).
Open Customer Data.xlsx, select Sheet 1 tab.
Click SigmaXL > Statistical Tools > Nonparametric Tests > 1 Sample
Sign. If necessary, check
Use Entire Data Table, click Next.
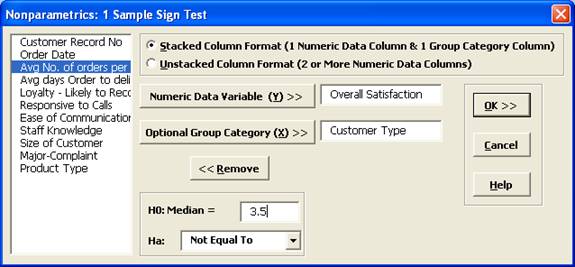
Ensure that Stacked Column Format is selected.
Select Overall Satisfaction, click Numeric Data Variable (Y)
>>; select Customer Type, click Optional Group
Category (X) >>.
Enter 3.5 for the Null Hypothesis H0: Median
value. Set Ha as Not Equal To.
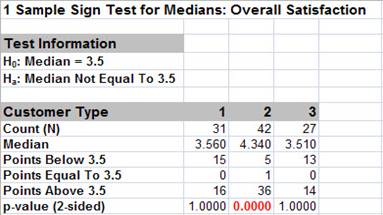
Click OK. Results:
Note the P-Values. Customer Type 2 shows a
significant change (increase) in Satisfaction Median (P-Value <
.05), whereas Customer Types 1 and 3 show no change (P-Value ≥ .05).
While the P-Values are not the same as those given by the 1 sample
t-Test, the conclusions do match.
If Count (N) is less than or equal to 50, the Sign Test computes an exact P-Value using
the binomial distribution.
For N > 50, the P-Value is estimated using a normal approximation.
Since this is always done automatically and is very fast, the Sign Test is not included
in the separate Nonparametric Exact menu.
One Sample Wilcoxon Signed Rank Test
The Wilcoxon Signed Rank test is a more powerful nonparametric test than the Sign Test, but
it adds an assumption that the distribution of values is symmetric around the median. An
example of a symmetric distribution is the uniform distribution. Symmetry can be observed
with a histogram, or by checking to see if the Skewness is large (> .5 or < - .5).
The One Sample Wilcoxon Test is a nonparametric equivalent to the parametric One
Sample t-Test.
Historically, our Median customer satisfaction score has been 3.5. We would like to
see if this has changed, with the results grouped by customer type (H0: Median =
3.5, Ha: Median ≠ 3.5, α = 0.05).
Open Customer Data.xlsx, select Sheet 1 tab
(or press
F4 to activate last worksheet). Click SigmaXL >
Statistical Tools > Nonparametric Tests > 1 Sample Wilcoxon.
If necessary, check
Use Entire Data Table, click Next.
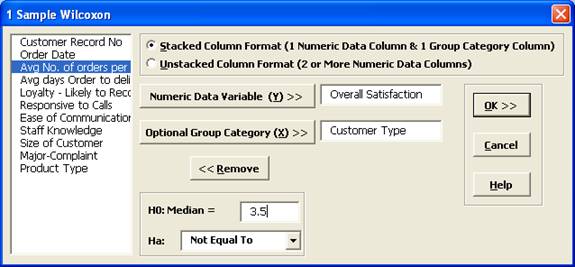
Ensure that Stacked Column Format is selected. Select
Overall Satisfaction, click Numeric Data Variable (Y)
>>; select
Customer Type, click Optional Group Category (X)
>>.
Enter 3.5 for the Null Hypothesis H0: Median value. Keep
Ha as Not Equal To.
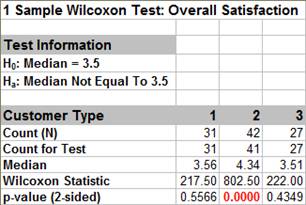
Click OK. Results:
Note the P-Values. Customer Type 2 shows a
significant change (increase) in Satisfaction Median (P-Value < .05),
whereas Customer Types 1 and 3 show no change (P-Value ≥ .05).
Although the P-Values are not identical to the sign test and t-Test, the
conclusions match.
(Note, in the case of Customer Type 2, the Sign Test is preferred since
the data is not symmetrical but skewed).