How Do I Create NP-Charts in Excel Using SigmaXL?
NP-Charts
- Open Attribute Data NP Chart Defectives.xlsx.
The subgroup size is constant at 50. NP Charts (for Defectives)
require a fixed subgroup size.
- Select SigmaXL > Control Charts > Attribute
Charts>
NP. Ensure that the entire data table is selected. If
not, check Use Entire Data Table. Click Next.
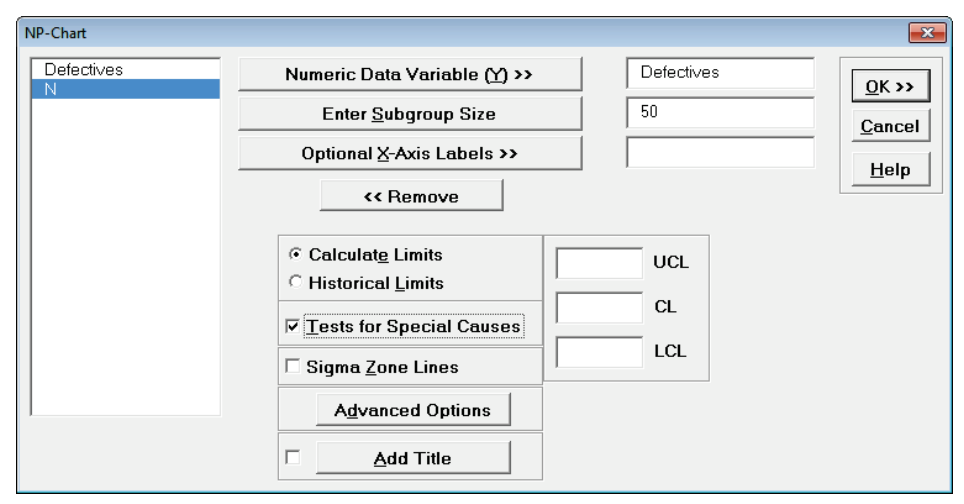
- Select Defectives, click Numeric Data Variable (Y)
>>;
enter 50 for Enter Subgroup Size. Check
Tests for Special Causes.
- Click OK. The resulting
NP-Chart is shown:
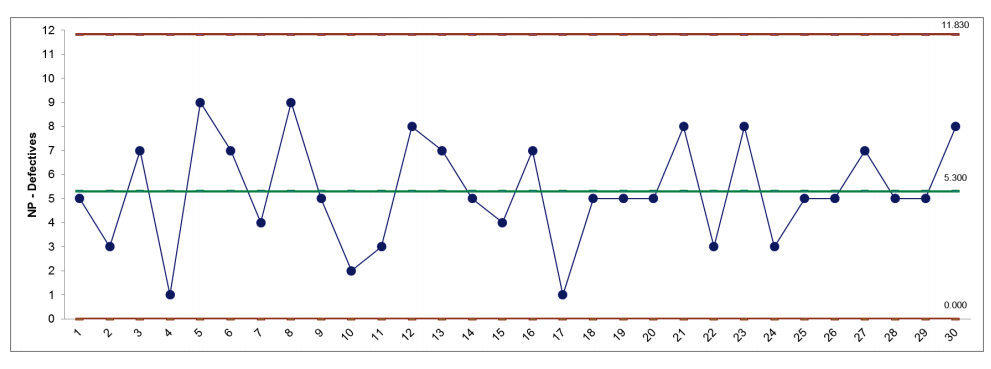
This is a stable process, with no tests for special causes
flagged.


