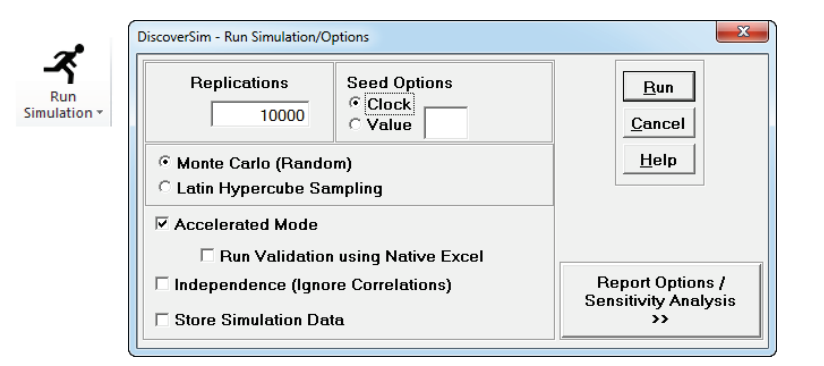
Replications value sets the number of simulation replications.
Seed is set to Clock by default so that the starting
seed of random number generation will be different with each run. If you want the
simulation results to match every time (for example in a classroom setting where you
want all students to obtain the same results), select Value and enter
an integer number. Note that the results of a fixed seed for 32-bit Excel will be
slightly different for 64-bit Excel.
Select Monte Carlo (Random) for full randomization. Latin
Hypercube Sampling is less random than Monte Carlo but enables more
accurate simulations with fewer replications. For further details see Appendix: Input Distribution Sampling.
Accelerated Mode uses DiscoverSims Excel Formula Interpreter to
dramatically increase the speed of calculations for rapid simulation. If unchecked, the
calculations are performed using native Excel. The interpreter supports the majority of
all Excel numeric functions (for more details see Appendix: DiscoverSim Engine and Excel Formula Interpreter). If
the DiscoverSim interpreter sees a function that it does not support, you will be
prompted to use Excels Native mode.
Run Validation using Native Excel runs a validation test to compare
Accelerated Mode versus Native Excel. Each output is assessed by comparing the
simulation means. If the worst case relative difference is less than or equal to 1e-10%,
the test passes and the status is Success. If the relative difference is between
1e-10% to 1e-4%, the status is Good, and if greater than or equal to 1e-4%, the test
status is Poor.
Check Independence (Ignore Correlations) to run the simulation with
all inputs independent of each other (zero correlation). This is recommended if you are
running a
Sensitivity Regression Analysis.
Check Store Simulation Data in Worksheet to store simulation input and
output data in a worksheet. The number of simulation replicates or runs must not exceed
the maximum number of rows permitted in the version of Excel that you are using and the
total number of inputs and outputs cannot exceed the maximum number of columns permitted
by Excel.
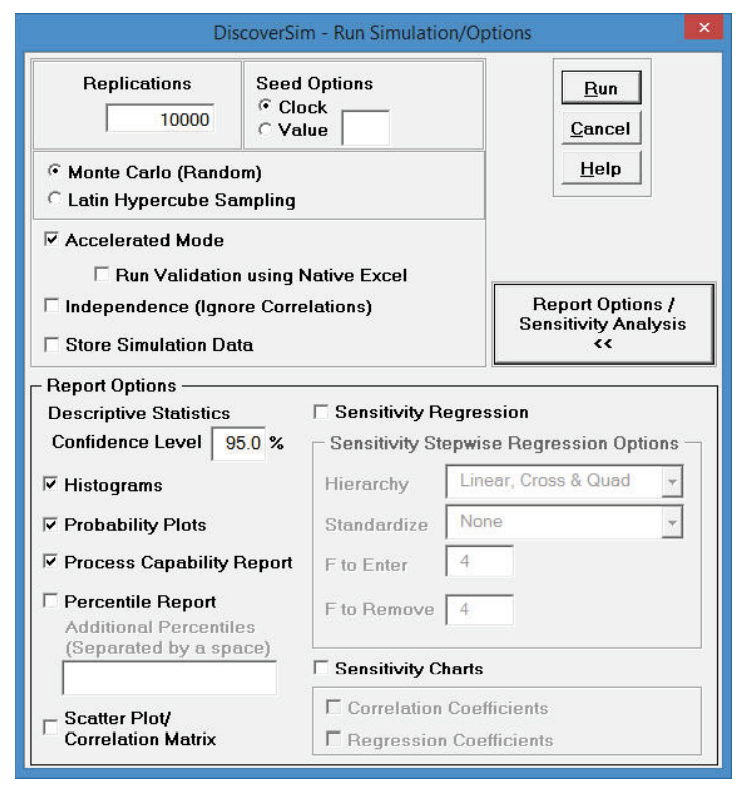
Click Report Options/Sensitivity Analysis to display all report
options.
Histograms, Probability Plots,
Descriptive Statistics, and Process Capability Report
are checked by default for display in the simulation report. These graphs and tables
apply only to the output response data. A report will be produced for each output.
Descriptive Statisticsare always reported.
They include confidence intervals for Mean, StdDev, and Median with a default 95%
level. The Confidence Level can be modified. Descriptive statistics
also include the normality tests: Anderson-Darling, Skewness and Kurtosis.
Histograms will display a normal curve and
specification limits (if applicable).
Probability Plots are normal probability
plots, but only display a small sample (500) of the data to speed up the report
display.
Process Capability Report requires at least
one specification limit.
Check Percentile Report to view a table with the following percentiles:
0.135, 1, 5, 10, 15, 20, 25, 30, 35, 40, 45, 50, 55, 60, 65, 70, 75, 80, 85, 90, 95, 99,
99.865.
Additional Percentiles can be added to the report by entering the
desired values, separated by a space.
A Percentile Process Capability report is also produced. These
indices should be used if the output response is not normally distributed:
Tip: Percentile Process Capability indices require a minimum of 10,000
replications in order to be reliable.
Check Scatter Plot/Correlation Matrix to view a Scatter Plot of outputs
versus outputs, outputs versus inputs, and inputs versus inputs. The correlation matrix
includes both Pearson and Spearman Rank correlation coefficients. Spearman Rank is
recommended for non-normal data.
Check Sensitivity/Regression Analysis to perform a backwards stepwise
regression analysis. This can be run on a specific output or all outputs.
Hierarchy options are:
Linear (Main Effects)
Linear & Quad (Main Effects and Quadratic Terms
Linear & Cross (Main Effects and Cross-Product 2-Way
Interactions)
If selected, Cross-Product and Quadratic terms are calculated and included in the initial
stepwise regression model along with the Main Effects. Following Hierarchy means that the
second order terms are removed from the model before the first order terms. If a
Cross-Product or Quadratic term remains in the model, the associated Main Effects will also
remain in the model, even if the Main Effect term is not significant.
Standardize options are:
None
Std: Mean=0, StdDev=1 ((Xi Mean)/StdDev)
Range -1 to +1 (Coded Xmin = -1; Xmax = +1)
Use one of the standardize options if you have a second order model and wish to avoid
additional collinearity that is introduced due to the multiplication of different units. The
disadvantage of this is that the model coefficients are then standardized or coded so will
not be as easy to interpret.
F to Enter allows you to set the value of F to enter a new variable in the
model (default is 4).
F to Remove allows you to set the value of F to remove a variable from the
model (default is 4).
Note: As mentioned above, it is highly recommended that you check
Independence (Ignore Correlations) when performing a
Sensitivity/Regression Analysis to avoid problems with
multi-collinearity.
Check Sensitivity Charts to view vertical bar chart(s) of:
Correlation Coefficients Sorted Spearman
Rank correlation for output versus each input. The sort is by magnitude, with the
chart x-axis range being -1 to +1.
Regression Coefficients Sorted R-Square
values for output versus each input, Cross-Product and Quadratic term that remain in
the Stepwise Regression model. R-Square for each final model term is obtained by
sequentially removing and replacing each term from the model, with the decrease in
model R-Square used as the term value.