Definitive Screening Design
- Home /
- DSD Analyze

Three-level Definitive Screening Designs were introduced by Jones and Nachtsheim [2], with the following desirable properties:
The number of required runs is only one more than twice the number of factors.
Unlike resolution III designs, main effects are completely independent of two-factor interactions. As a result, estimates of main effects are not biased by the presence of active two-factor interactions, regardless of whether the interactions are included in the model.
Unlike resolution IV designs, two-factor interactions are not completely confounded with other two-factor interactions, although they may be correlated.
Unlike resolution III, IV, and V designs with added center points, all quadratic effects are estimable in models comprised of any number of linear and quadratic main-effects terms.
Quadratic effects are orthogonal to main effects and not completely confounded (though correlated) with interaction effects.
With 6 through (at least) 12 factors, the designs are capable of estimating all possible full quadratic models involving three or fewer factors with very high levels of statistical efficiency. Note that this assumes sparsity of effects.
DSDs accommodate both continuous and two-level categorical factors [3], providing versatility for a wide range of applications.
You can add runs to a DSD by creating a DSD with more factors than necessary and dropping the extra factors. The resulting design has all of the properties above and has more power as well as the ability to identify more second-order effects
For formula details, see the Appendix: Definitive Screening Design.
Montgomery adds: "These designs are an excellent compromise between resolution III fractions for screening and small RSM designs. They also admit the possibility of moving directly from screening to optimization using the results of a single experiment" [5].
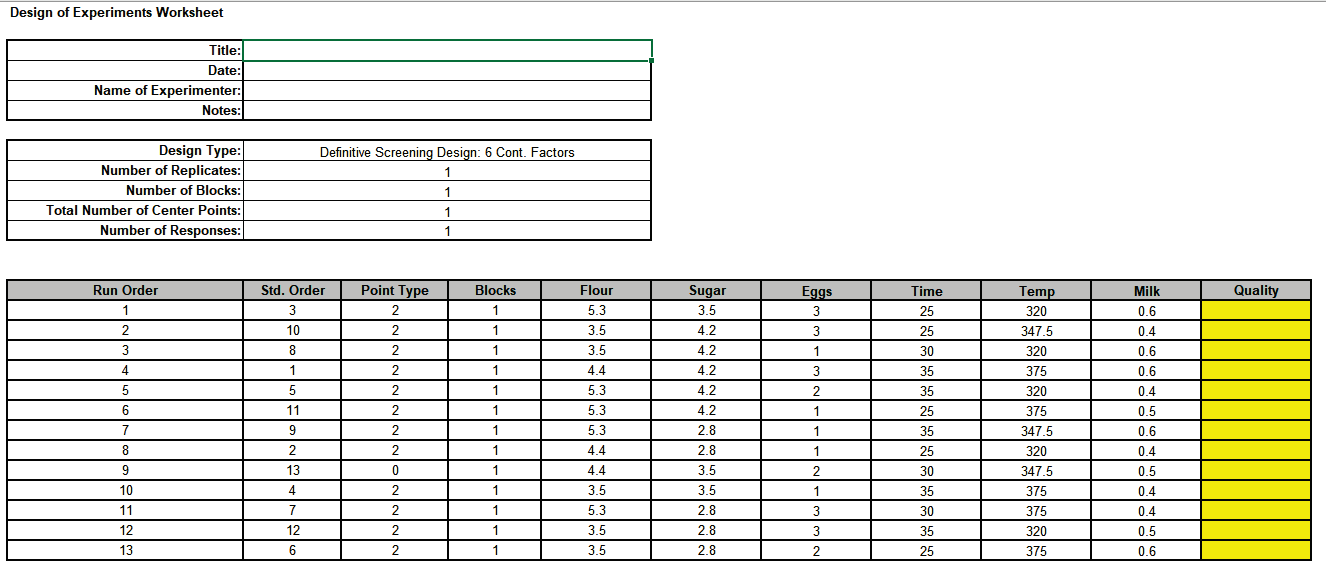
We will begin with the creation of a unrandomized 6 continuous factor Definitive Screening Design to be able to clearly view the design run details SigmaXL > Design of Experiments > Advanced Design of Experiments: Definitive Screening > Definitive Screening Designs. Select Number of Continuous Factors = 6, uncheck Randomize Runs and Fraction of Design Space (FDS) Plots. Keep the remaining options unchanged from the defaults as shown.
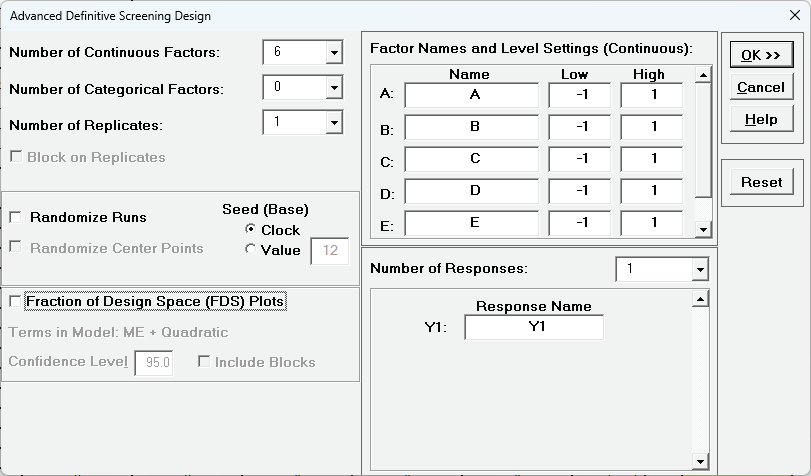
Click OK
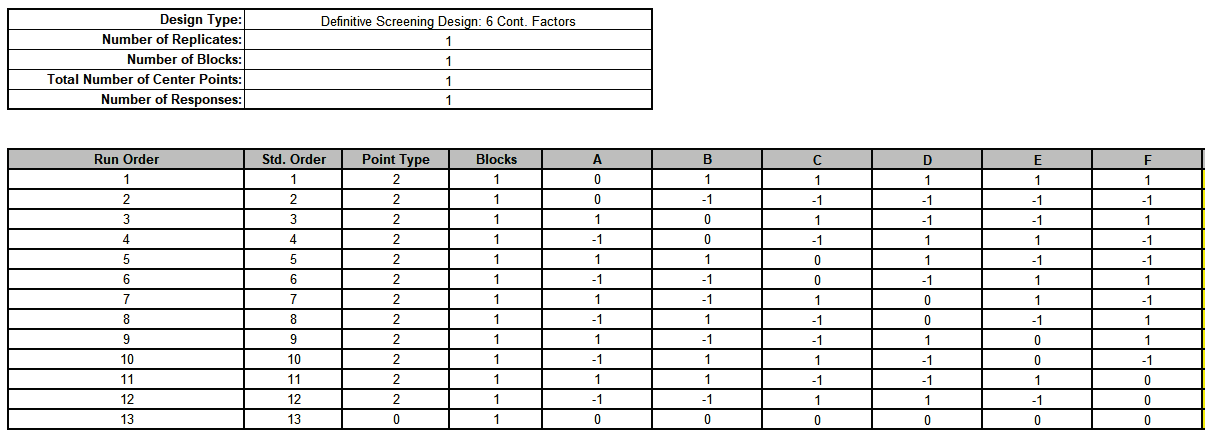
Notice the structure of the design: Runs 1 and 2 have Factor A set to 0 and Factors B to F are foldover pairs. This pattern is repeated for each Factor. Run 13 is a center point.
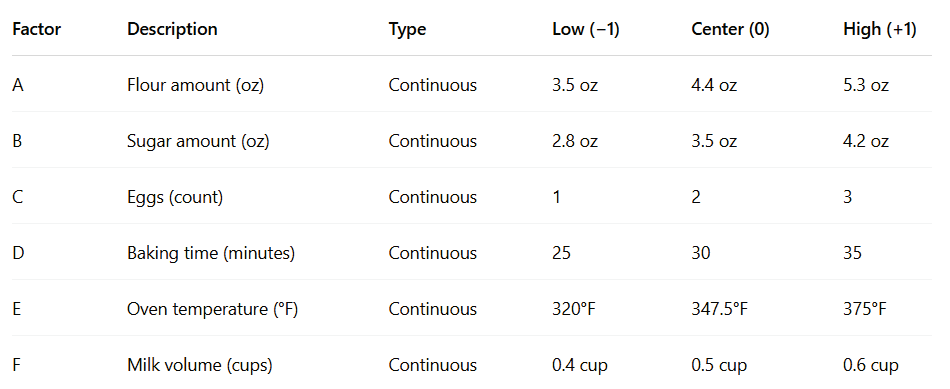
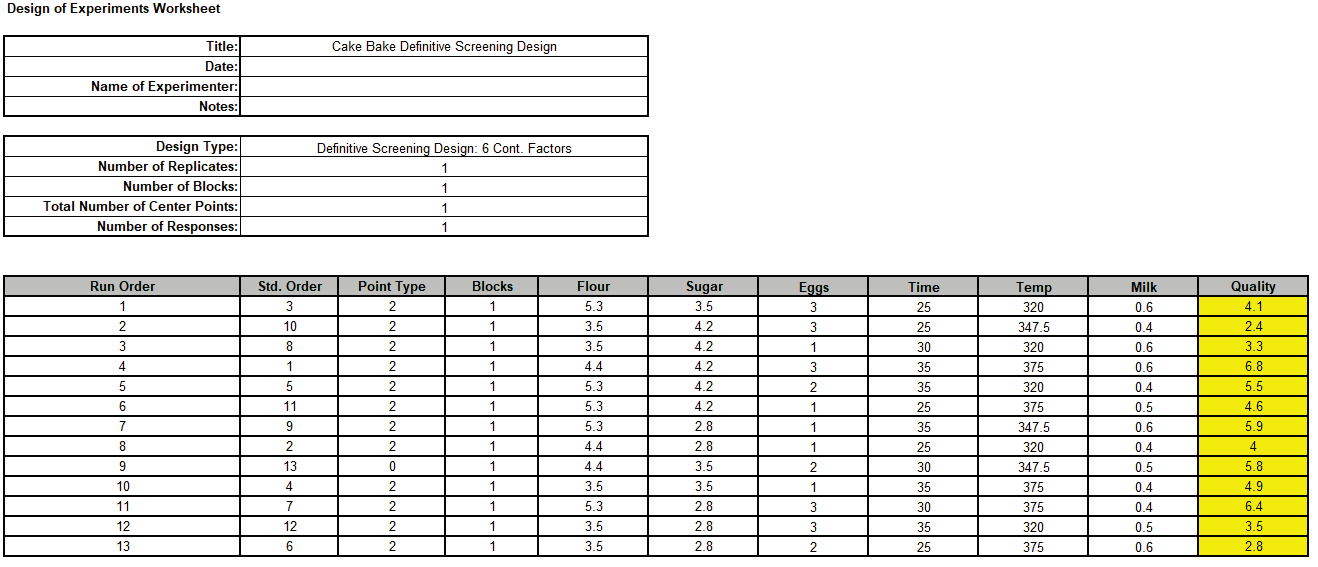
Now we will create the 6 Factor Cake Bake design. The response variable is Cake Quality Score (composite of texture, rise, and taste on a 1-7 scale, judged by a sensory panel). The goal is to identify the most influential factors and to maximize the cake quality.
The Factors and Levels are:
Click Recall SigmaXL Dialog. Enter the Factor Names and Level Settings as shown. Check Randomize Runs, select Seed (Base) Value = 12 and other options as shown:
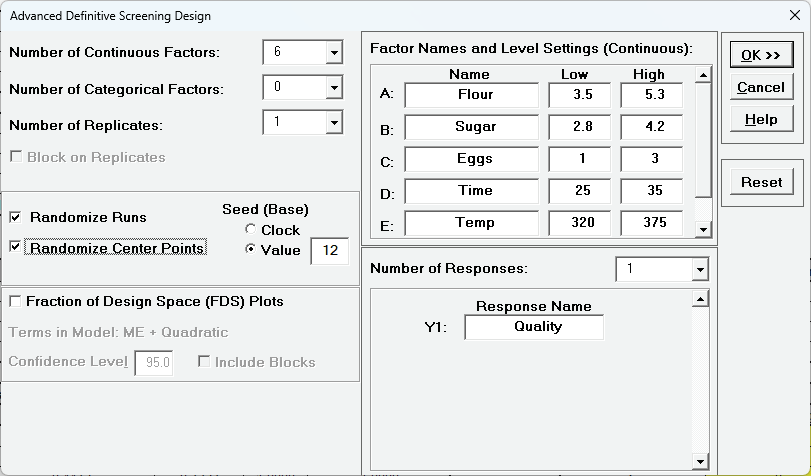

Click OK The Definitive Screening Design Worksheet is given as:
Open the file DSD Six Factor Cake Bake.xlsx. This has the design worksheet populated with Quality values.
Click SigmaXL > Design of Experiments > Advanced Design of Experiments: Definitive Screening > Analyze Definitive Screening Design.
Select Response and Model Terms as shown with Term Generator r as ME + Quadratic. Click Select All >>. With 12 model terms plus the constant, there will be no degrees of freedom for error, so uncheck Residual Plots. Check Main Effects Plots. We will not modify Advanced Options.
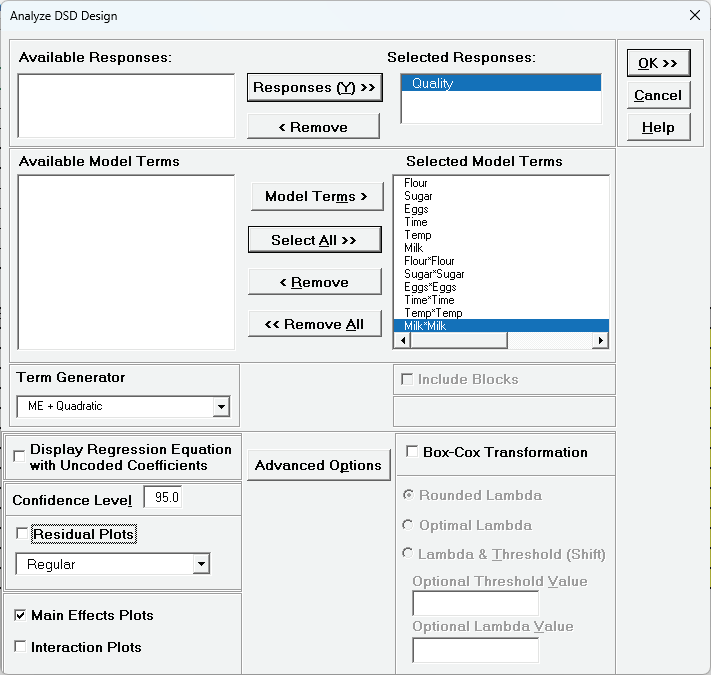
Click OK
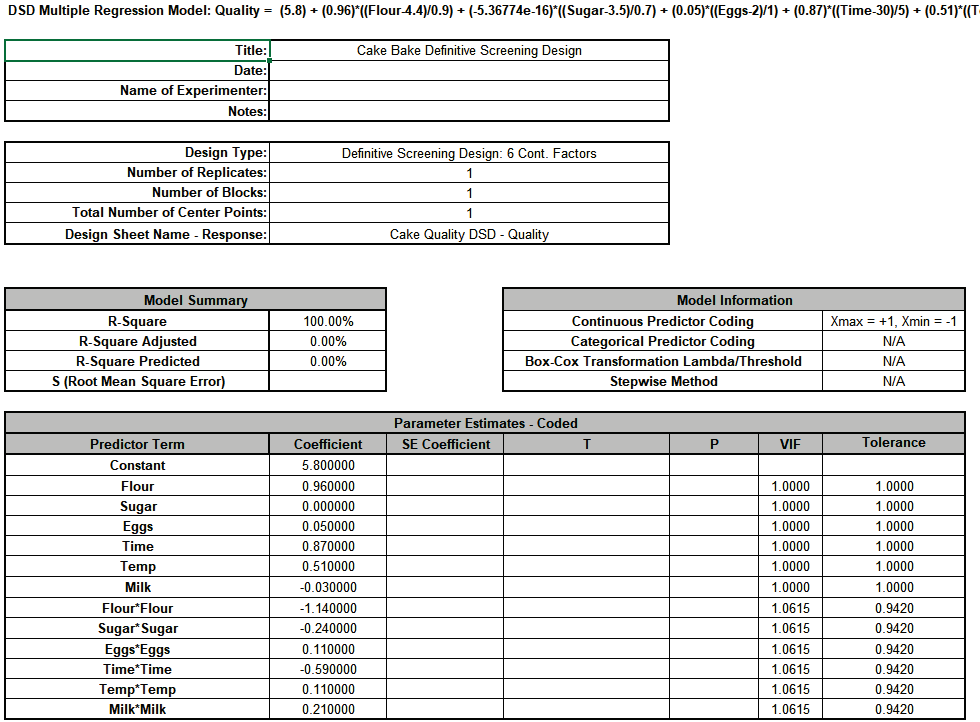
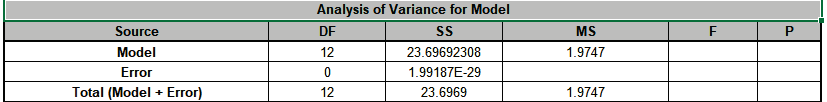
SE Coefficient, F and P-Values are not available because Error DF = 0. Note, Lenth's pseudo standard error is not applicable to 3 Level Definitive Screening Designs.
The Pareto Chart of Term R-Square is given:
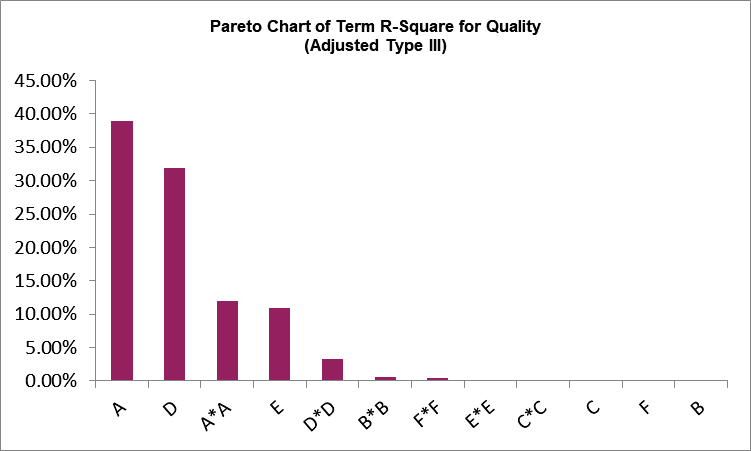
From the Pareto Chart, we can clearly see that A=Flour, D=Time and E=Temp are the dominant main effects, along with quadratic terms A*A and possibly D*D.
Click on Sheet AdvDSD - Plots The Main Effects Plots for Quality are shown. These are calculated from the fitted means and include curvature from the quadratic terms.
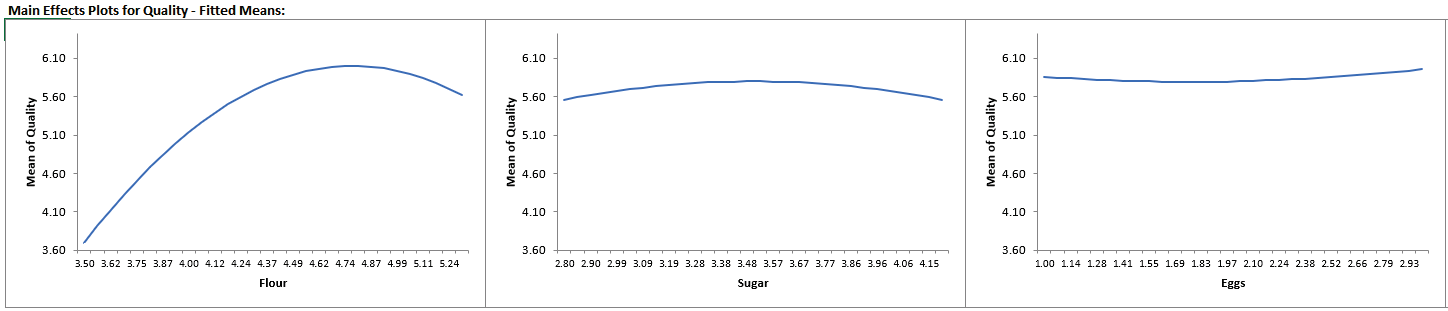
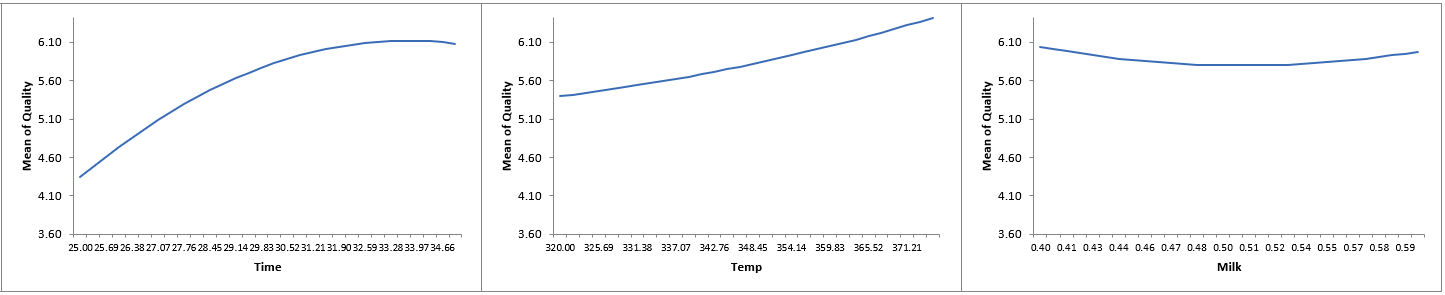
Again, we can see that Flour, Time and Temp are the dominant factors affecting Quality.
Now we will re-analyze the data but only include Flour, Time and Temp with their quadratic terms, plus we will add their 2-way interactions. The ability to do this for up to 3 terms is a feature of the definitive screening design, but only if effect sparsity is true, which does appear to be the case here.
Click Recall SigmaXL Dialog.
Select Responses and Model Terms as shown with Term Generator as ME + 2-Way Interactions + Quadratic. Using the Model Terms button, select the main effect terms: Flour, Time, Temp, the interaction terms: Flour*Time, Flour*Temp, Time*Temp and the quadratic terms: Flour*Flour, Time*Time, Temp*Temp. Check Residual Plots. We will not modify Advanced Options at this time.
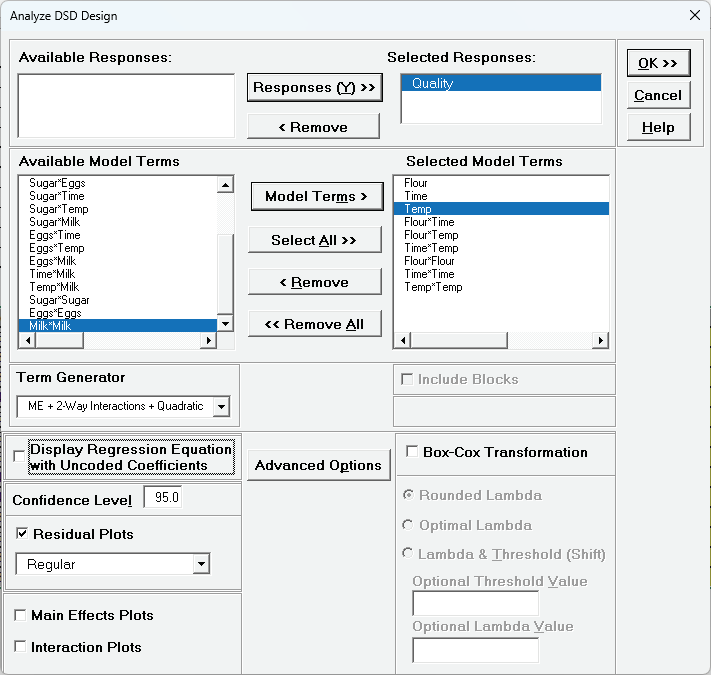
Click OK
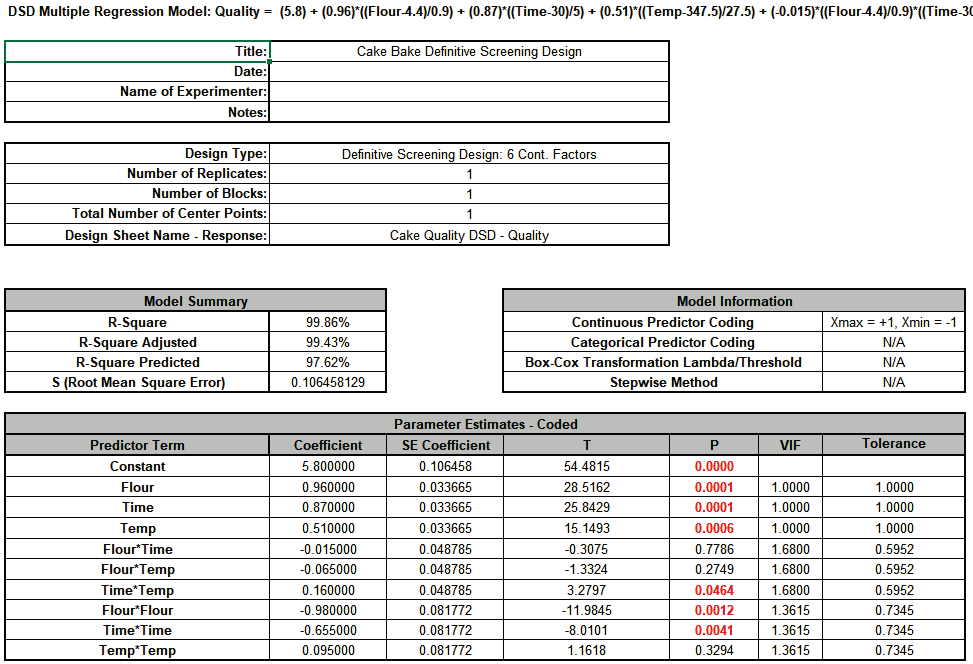
The R-Square, R-Square Adjusted and R-Square Predicted all look very good. Main effects: Flour, Time, Temp, the interaction: Time*Temp and the quadratic terms: Flour*Flour and Time*Time are significant with P-Values <0.05. Note that while this is not an orthogonal design for the higher order terms, the VIF scores are acceptable (< 5 )
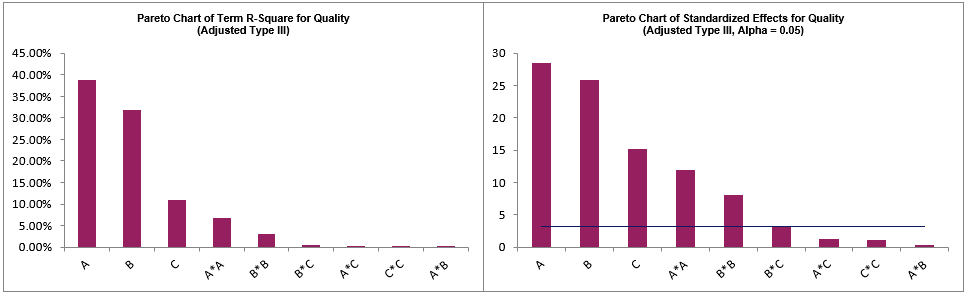
The Pareto Charts of Term R-Square and Standardized Effects are given:
Next, we will refine the model using Best Subsets Regression. Click Recall SigmaXL Dialog.
Click Advanced Options Check Stepwise/Best Subsets Regression with options as shown.
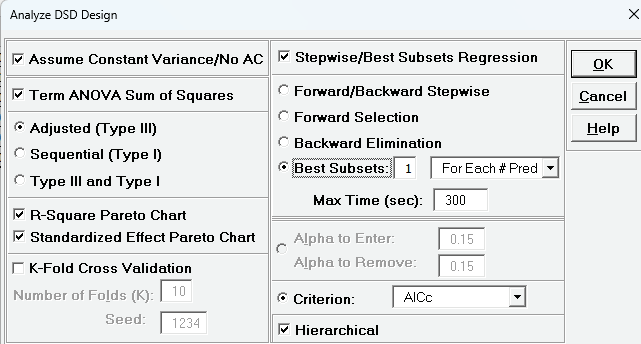
With fewer than 15 potential terms, best subsets will evaluate all possible combinations (exhaustive search) for minimum AICc.
Click OK Click OK
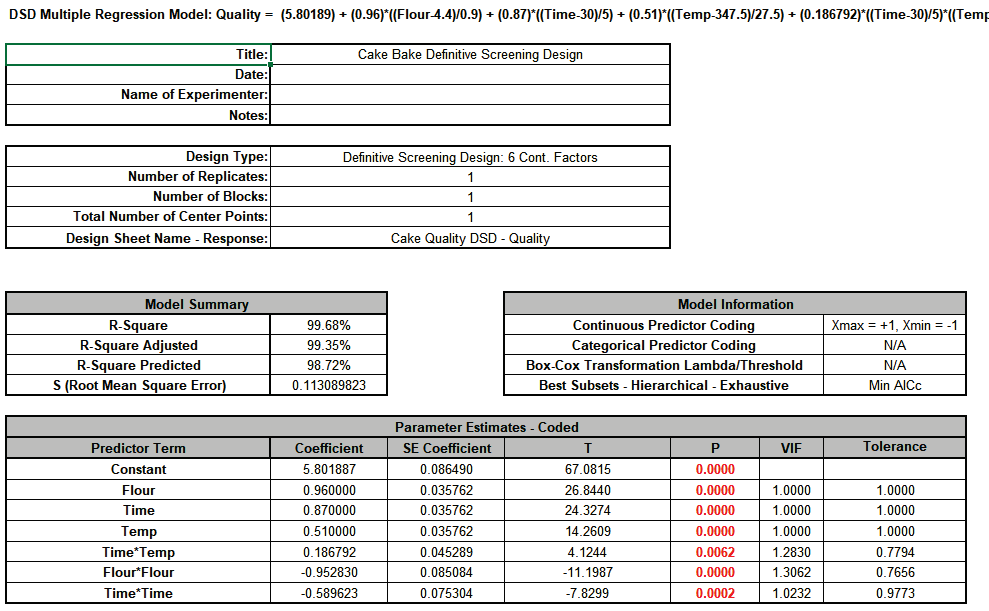
The best subsets model removed the two insignificant interactions
Click on the sheet AdvDSD - Residuals.
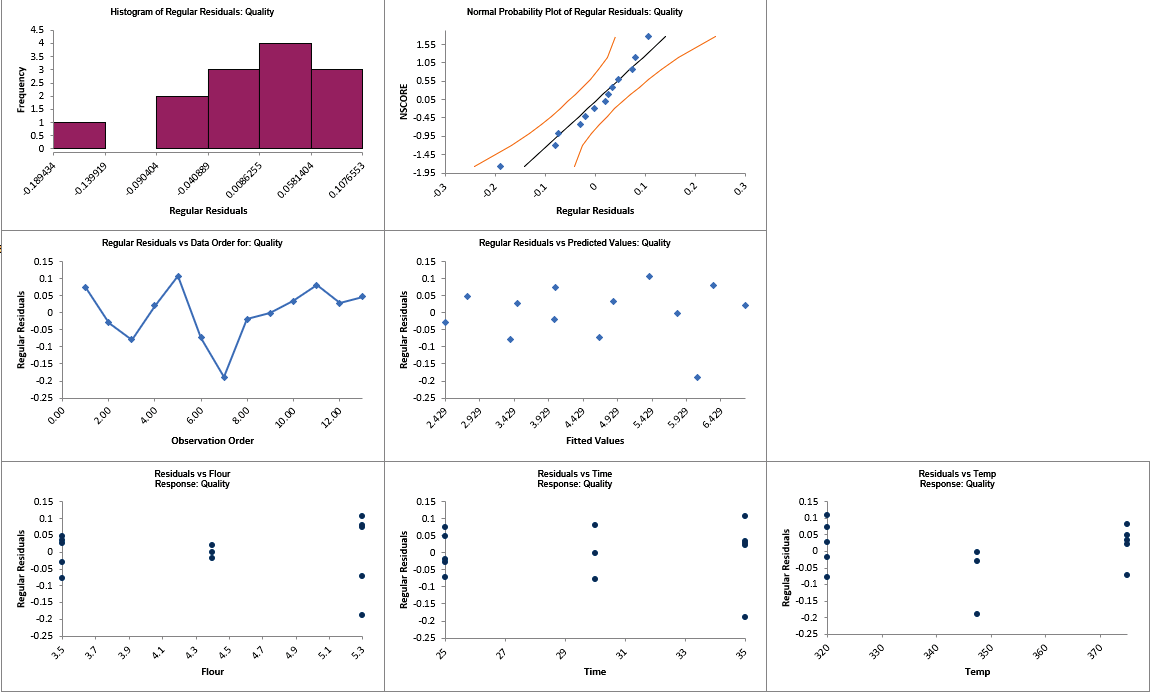
he top four residual plots look ok, with no obvious non-normality or patterns. The Residuals vs Flour shows some possible inequality of variance (this can also be seen in the Breusch-Pagan Test for Constant Variance where Flour has a significant P-Value), but we will not explore this further in this example. The Residuals vs Temp shows some possible curvature but we already tested Temp*Temp and found it to be insignificant.
Click on the Sheet AdvDSD - Model Quality. Scroll to the Predicted Response Calculator and Optimize Button. Select Goal as Maximize.
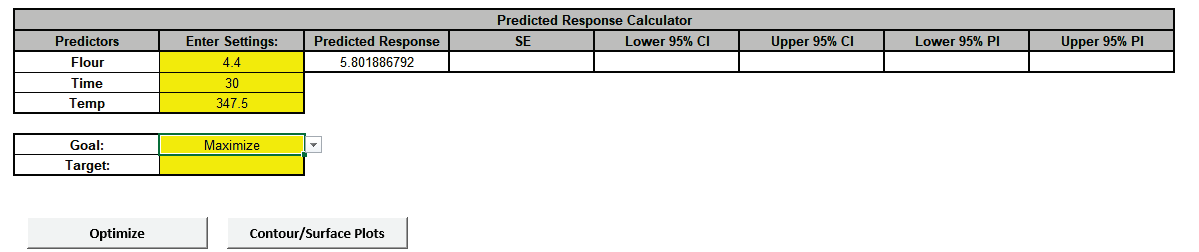
Click The response solution and prompt to paste values into the Input Settings of the Predicted Response Calculator is given: Optimize . The response solution and prompt to paste values into the Input Settings of the Predicted Response Calculator is given:
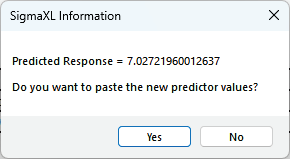
Click Yes to paste the values.

So, Flour = 4.85 oz, Time = 34.5 min and Temp = 375 F, give the maximum cake Quality score.
Next, we will create a Contour/Surface Plot to visualize the response with these settings. Click the Contour/Surface Plots button.
A new sheet is created, AdvAug1 - Contour that displays the plots:
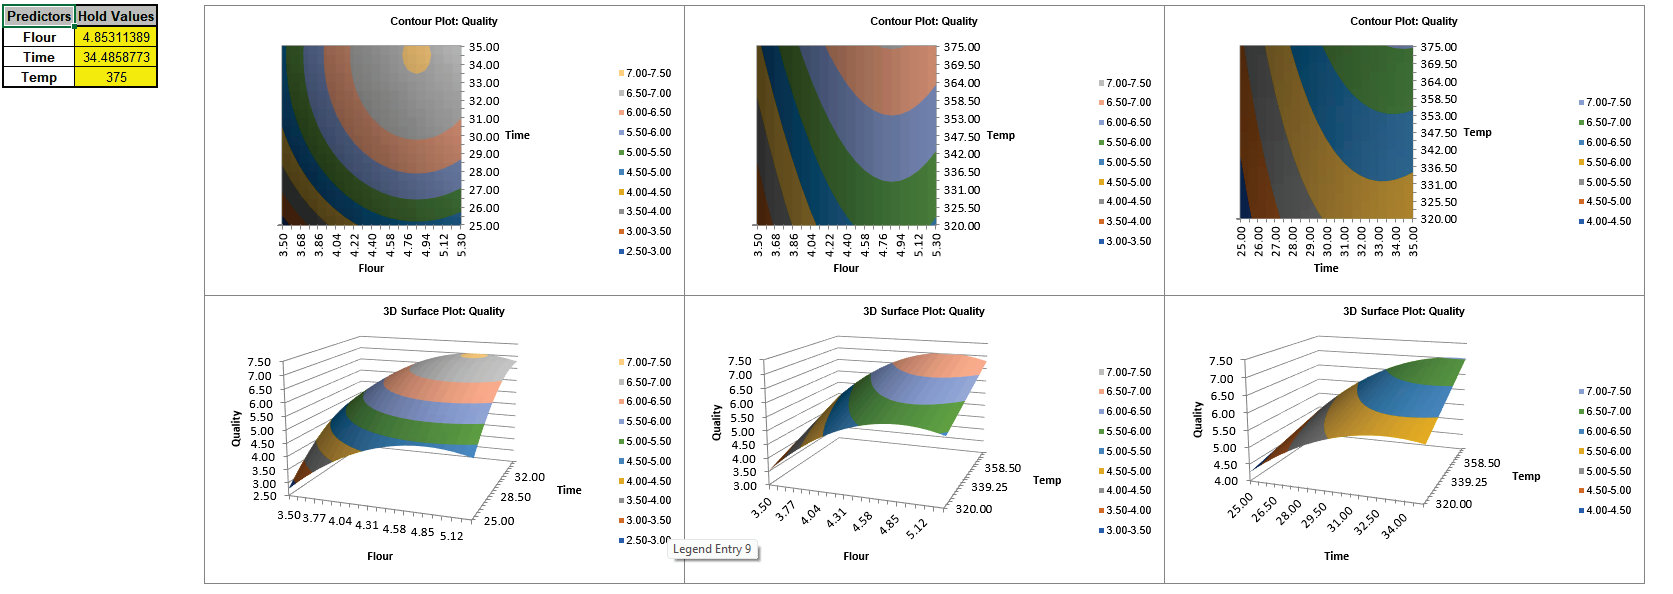
With 3 factors, 3 Contour/Surface plots are created. The table with the Hold Values, gives the values used to hold a predictor constant if it is not in the plot.
In conclusion, we can see the power of the definitive screening design as Montgomery noted, “These designs are an excellent compromise between resolution III fractions for screening and small RSM designs. They also admit the possibility of moving directly from screening to optimization using the results of a single experiment” [5].


