Attribute P ARL
► Click here for an introduction on Average Run Length (ARL) templates
-
Click SigmaXL > Templates & Calculators > Control
Chart Templates > Average Run Length (ARL)
Calculators >Attribute P ARL. This template is
also located at SigmaXL > Control Charts >
Control Chart Templates> Average Run Length (ARL)
Calculators >Attribute P ARL.
-
The default template settings are Specify =
Exact (Test 1 Only), Subgroup Size = 50,
In-Control Historical Proportion (CL) = 0.5.
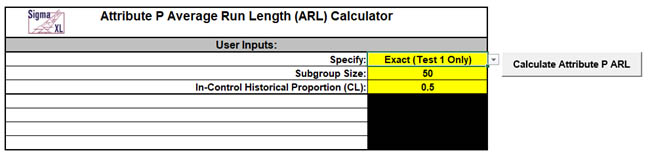
Notes: Specify Exact (Test 1 Only) or
Monte Carlo using the drop-down list. Parameters to
be specified will be shown in yellow highlight,
otherwise they are hidden. Exact uses the binomial
cumulative distribution function. Monte Carlo
simulation uses binomial random data with specified
proportion and allows you to assess the ARL
performance of all 4 Tests for Special Causes. Test
1 - 1 point more than 3 standard deviations from the
center line (CL) is always applied. Monte Carlo
simulation also produces the table of Run Length
Standard Deviation and Percentiles (scroll right to
view).
-
Click the Calculate Attribute P ARL button to
reproduce the ARL table and chart.
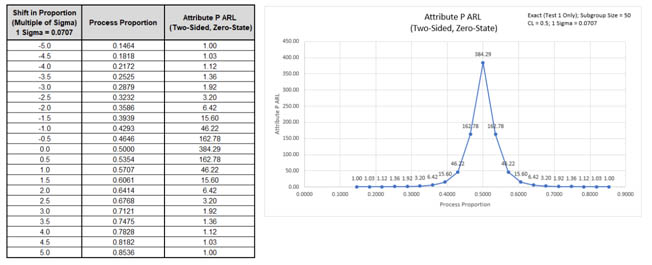
The ARL0 (in-control ARL with 0 sigma
shift in proportion) for the Attribute P chart is
384.29. The ARL1 for a small 1 sigma shift is 46.22,
so is slow to detect. On the other hand, a large 3
sigma shift in proportion has an ARL = 1.92, so is
detected rapidly.
Note: The Process Proportion
values are displayed on the ARL chart, but the shift
in proportion as a multiple of sigma is also
included in the table.
-
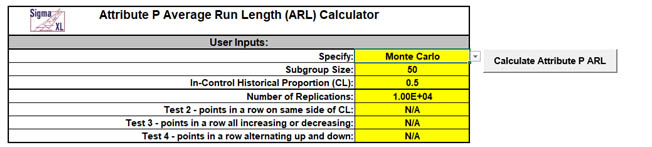
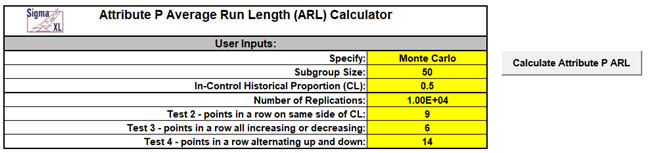
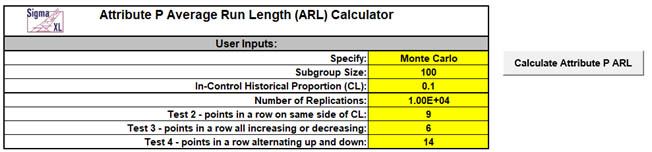
Now we will use Monte Carlo simulation to obtain
approximate Run Length standard deviation and
percentiles for the Attribute P chart. Select
Specify = Monte Carlo. Enter Subgroup Size
= 50, In-Control Historical Proportion (CL) =
0.5, Number of Replications = 1e4, Test 2
= N/A, Test 3 = N/A, Test 4 = N/A.
-
Click the Calculate Attribute P ARL button to
produce the Monte Carlo approximate ARL table, ARL
chart and Run Length Standard Deviation and
Percentiles table (scroll right to view). Monte
Carlo simulation with 10,000 (1e4) replications will
take about a minute to run.
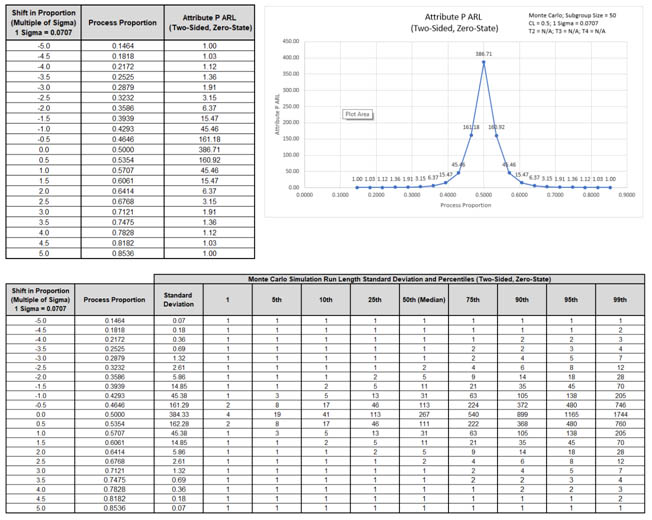
The additional run length statistics show the
large variation of run length values. The MRL0 = 267
(in-control median run length with 0 sigma shift in
process proportion).
Note: The results will vary
slightly since this is Monte Carlo simulation.
-
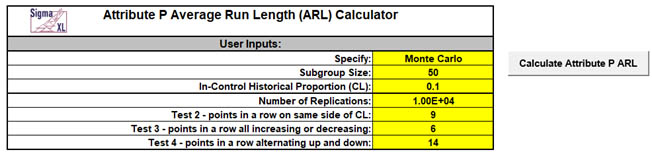
Now we will use Monte Carlo simulation to assess the
Attribute P chart with all 4 Tests for Special
Causes applied. Enter Specify = Monte Carlo,
Subgroup Size = 50, In-Control Historical
Proportion (CL) = 0.5, Number of Replications
= 1e4, Test 2 = 9, Test 3 = 6, and
Test 4 = 14.
Note: These are the test settings
used as defaults in SigmaXL > Control Charts >
Tests for Special Causes Defaults. Test 1 is
always applied.
-
Click the Calculate Attribute P ARL button to
produce the Monte Carlo approximate ARL table, ARL
chart and Run Length Standard Deviation and
Percentiles table:
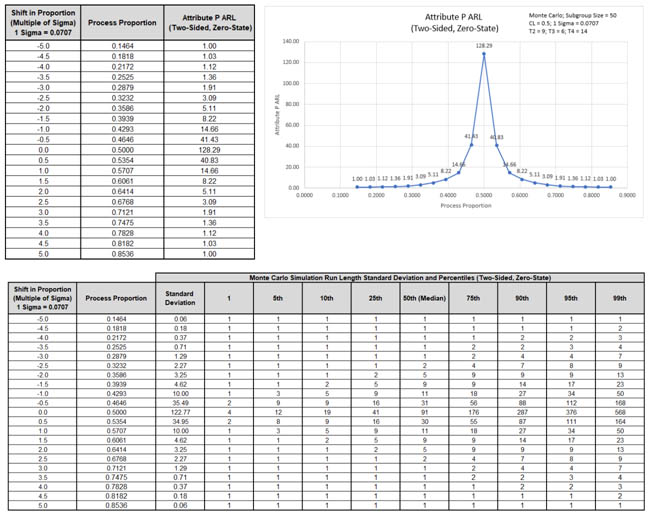
ARL0 with all 4 tests for special causes is
approx. 128.3. This is a poor performance with a 3 x
increase (384.3/128.3) in false alarms compared to
Exact Test 1 only. MRL0 is approx. 91. On the other
hand, ARL1 for a small 1 sigma shift in proportion
is approx. 14.7, so is much faster to detect than
the Exact Test 1 only ARL1 of 46.22.
-
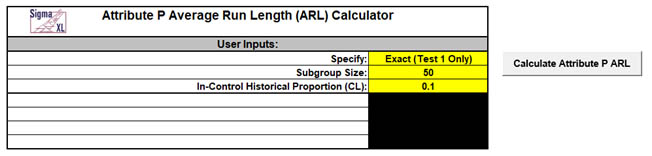
We will now assess ARL for a low in-control
proportion value. Enter Specify = Exact (Test
1 Only), Subgroup Size = 50, In-Control
Historical Proportion (CL) = 0.1.
-
Click the Calculate Attribute P ARL button to
produce the ARL table and chart for these settings:
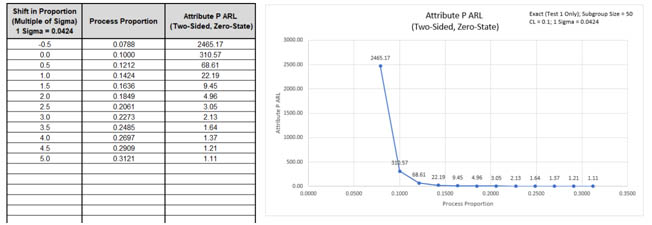
The ARL0 for the Attribute P chart is 310.57.
The ARL1 for a small positive 1 sigma shift in
proportion is 22.19, so is slow to detect. On the
other hand, a large positive 3 sigma shift in
proportion has an ARL = 2.13, so is detected
rapidly. The ARL for a small negative 0.5 sigma
shift in proportion is 2465.7 so negative shifts
cannot be detected with these settings.
Note: The P Chart LCL is 0 for
this CL value.
-
Now we will use Monte Carlo simulation to assess ARL
for a low in-control proportion value but with all 4
Tests for Special Causes applied. Enter Specify
= Monte Carlo, Subgroup Size = 50,
In-Control Historical Proportion (CL) = 0.1,
Number of Replications = 1e4, Test 2 = 9,
Test 3 = 6, and Test 4 = 14.
-
Click the Calculate Attribute P ARL button to
produce the ARL table and chart for these settings.
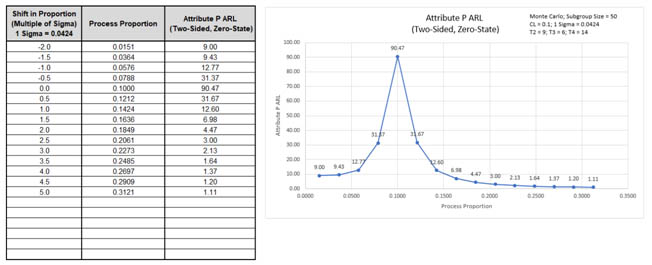
ARL0 with all 4 tests for special causes is
approx. 90.5. This is a poor performance with a 3.4
x increase (310.6/90.5) in false alarms compared to
Exact Test 1 only. On the other hand, ARL1 for a
small 1 sigma shift in proportion is approx. 12.6,
so is much faster to detect than the Exact Test 1
only ARL1 of 22.19. Also, it is now possible to
detect a negative one or two sigma shift in
proportion.
-
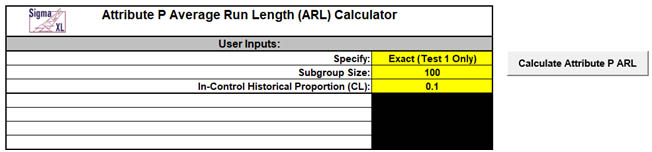
We will now assess ARL for a low in-control
proportion value but with larger subgroup size.
Enter Specify = Exact (Test 1 Only),
Subgroup Size = 100, In-Control Historical
Proportion (CL) = 0.1.
-
Click the Calculate Attribute P ARL button to
produce the ARL table and chart for these settings:
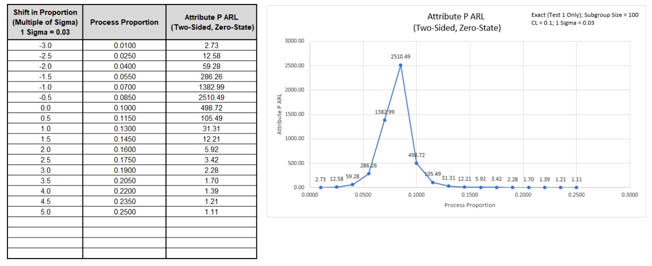
The mean is 31.31, so is slow to detect. On the
other hand, a large positive 3 sigma shift in
proportion has an ARL = 2.28, so is detected
rapidly. Small negative shifts still cannot be
detected, but a large negative 3 sigma shift in
proportion can be detected with ARL = 2.73.
-
Now we will use Monte Carlo simulation to assess ARL
for a low in-control proportion value with subgroup
size = 100, but with all 4 Tests for Special Causes
applied. Enter Specify = Monte Carlo,
Subgroup Size = 100, In-Control Historical
Proportion (CL) = 0.1. Number of Replications
= 1e4, Test 2 = 9, Test 3 = 6, and
Test 4 = 14.
-
Click the Calculate Attribute P ARL button to
produce the ARL table and chart for these settings:
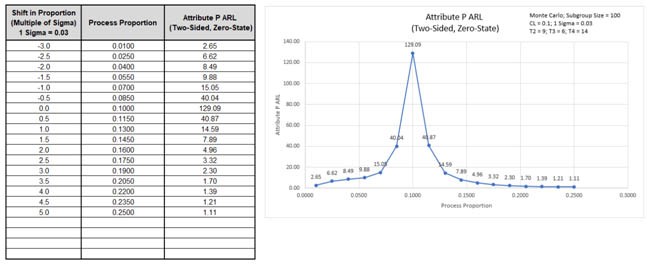
ARL0 with all 4 tests for special causes is
approx. 129.1. This is a poor performance with a 3.9
x increase (498.7/129.1) in false alarms compared to
Exact Test 1 only. On the other hand, ARL1 for a
small 1 sigma shift in proportion is approx. 14.6,
so is much faster to detect than the Exact Test 1
only ARL1 of 31.31. Also, it is now possible to
detect a negative one, two or three sigma shift in
proportion.
Template Notes:
- Specify Exact (Test 1 Only) or Monte Carlo
using the drop-down list. Parameters to be specified
will be shown in yellow highlight, otherwise they are
hidden.
- Exact uses the binomial cumulative distribution
function. Monte Carlo simulation uses binomial random
data with specified proportion and allows you to assess
the ARL performance of all 4 Tests for Special Causes.
It also produces the table of Run Length Standard
Deviation and Percentiles (scroll right to view).
- Test 1 - 1 point more than 3 standard deviations
from the center line (CL) is always applied.
- Enter the Subgroup Size.
- Enter the In-Control Historical Proportion (CL).
This is a value between 0 and 1.
- If applicable, enter Number of Replications.
1000 (1e3) replications will be fast, approx. 10
seconds, but will have an ARL0 error approx. = +/- 10%;
10,000 (1e4) replications will take about a minute, with
an ARL0 error = +/- 3.2%; 100,000 (1e5) replications
will take about ten minutes, with an ARL0 error = +/-
1%.
- If applicable, select values for Tests 2 to 4 using
the drop-down list. "N/A" indicates that the test is not
applied. Tests 2 and 3 provide options that match those
provided in SigmaXL's 'Tests for Special Causes'
Defaults dialog.
- Click the Calculate Attribute P ARL button to
produce the ARL table and chart. If Monte Carlo was
selected, the table of Run Length Standard Deviation and
Percentiles will also be produced.
- The Attribute P ARL is for a two-sided chart with
zero-state, i.e., the shift is assumed to occur at the
start. The proportion is also assumed to be known. This
will not likely be the case in use, but is still useful
for determining parameter settings and comparison of ARL
across chart types.
- The ARL Chart is similar to an Operating
Characteristic (OC) Curve, except that the Y axis is ARL
rather than Beta probability. Note that the P chart may
be ARL biased, with maximum ARL occurring above or below
the CL.
- Due to the complexity of calculations, SigmaXL must
be loaded and appear on the menu in order for this
template to function. Do not add or delete rows or
columns in this template.
REFERENCES:
- Montgomery, D.C. (2013), Introduction to Statistical
Quality Control, Seventh Ed., Wiley.


