Advanced 2-Level Factorial/Screening Design with Augment
- Home /
- Analyze Augment

We will illustrate the use of an Advanced 2-Level Factorial/Screening Design with the famous seven factor, eight run, 2^(7-4), bicycle experiment given in Example 6.5 of the Box, Hunter, Hunter book (Box, G. E. P., Hunter, J. S, Hunter, W. G. (2005), Statistics for Experimenters: Design, Innovation and Discovery, Second Edition, John Wiley and Sons). The response variable is the time it took to climb a particular hill in seconds. The runs were made in random order, but will be given here in standard order to match the book. The seven categorical factors are
After analysis, the design will be augmented to add a foldover on a specific factor to estimate it free of aliasing (BHH Example 6.8).
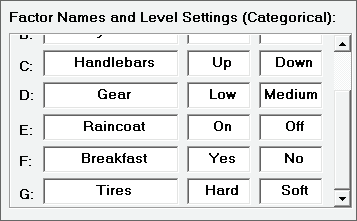
Click SigmaXL > Design of Experiments > Advanced Design of Experiments: 2-Level Factorial/Screening > 2-Level Factorial/Screening Designs. Select Number of Categorical Factors = 7 and Number of Continuous Factors = 0. Enter Factor Names and Level Settings as shown. Scroll down to enter Names and Level Settings for Factors F and G. Enter Response Name as Time.
With the default Design Power Information Terms in Model All Main Effects, a message is given "Power cannot be calculated when there are no degrees of freedom for error", so change Design Power Information Terms in Model to One Main Effect. Uncheck Randomize Runs.
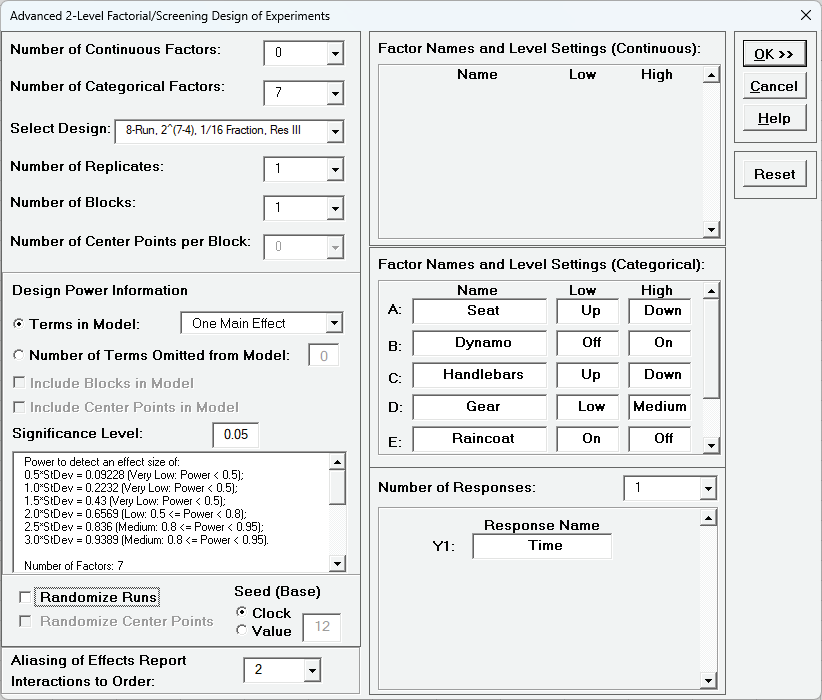
This design has medium power to detect an effect size = 2.5*StDev (using a One Main Effect model with error degrees of freedom = 6).
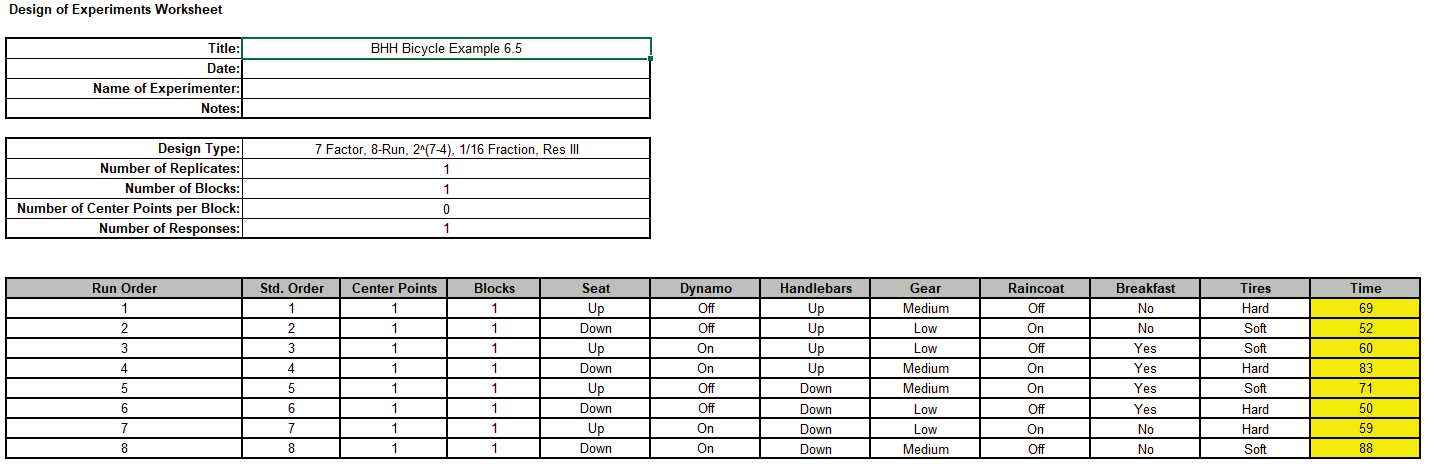
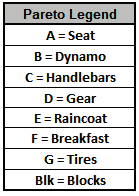
Click OK. The following Design of Experiments Worksheet is produced including the Legend, Design Generators, Aliasing of Effects and Design Power Information:
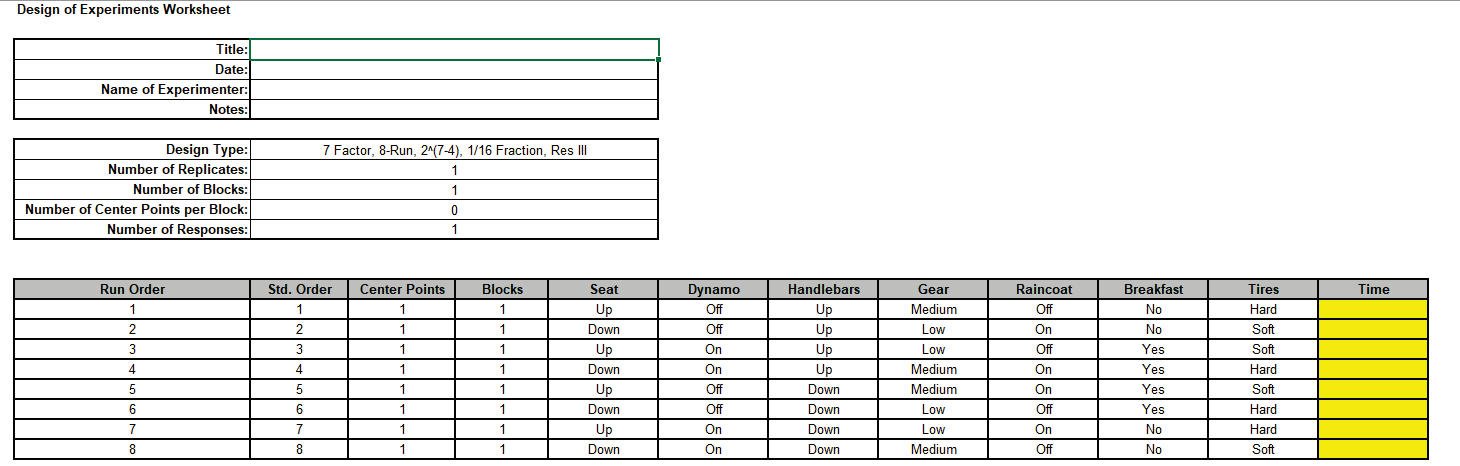
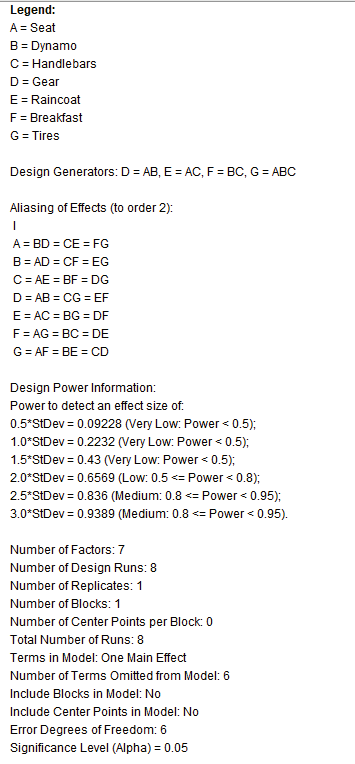
The design generators match those given in the book. Aliasing of Effects (to order 2) is given. When using a Resolution III design like this, we assume that the two-way interactions are negligible relative to the main effects.
Open the file BHH Bicycle.xlsx. Click on Sheet BHH Bicycle 1. This has the design worksheet populated with Time values.
Click SigmaXL > Design of Experiments > Advanced Design of Experiments: 2-Level Factorial/Screening > Analyze 2-Level Factorial/Screening Design.
Select Responses and Model Terms as shown with Term Generator as Main Effects. Uncheck Residual Plots (since we have 0 degrees of freedom for error). Check Main Effects Plots.
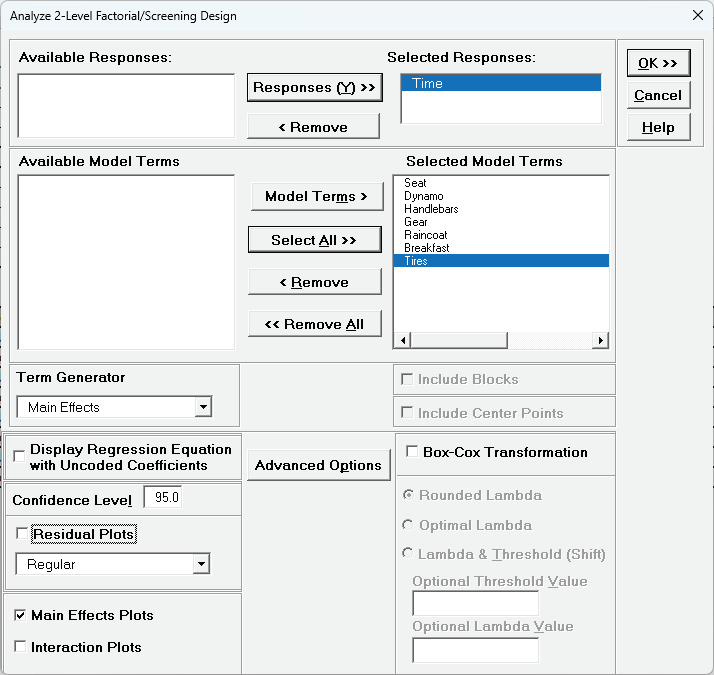
Click ok.
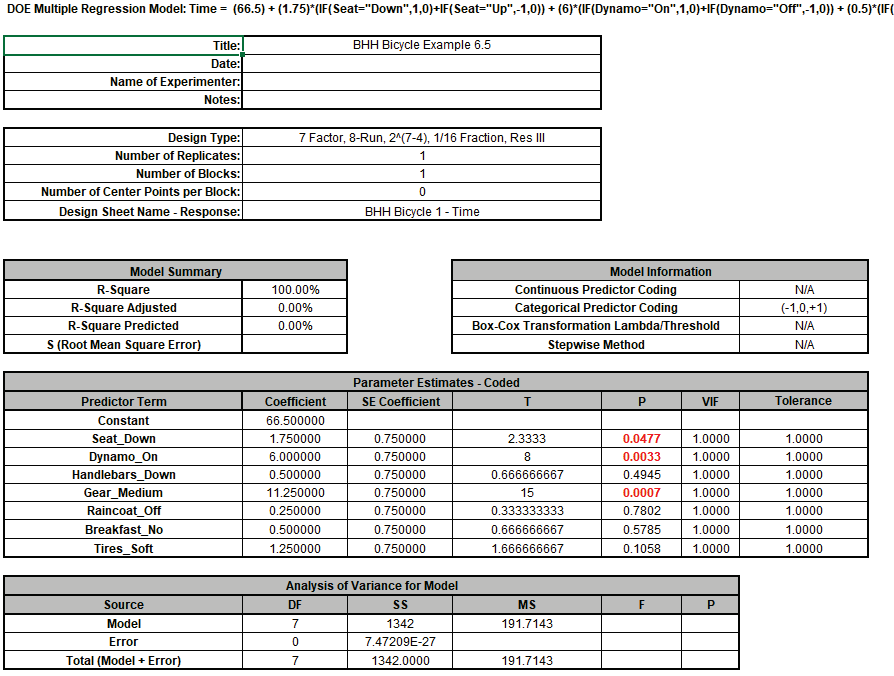
Note that since this is a saturated model, SE Coefficients are computed using Lenth Pseudo Standard Error. P-Values are computed using Monte Carlo simulation with 10000 replications. Seat, Dynamo and Gear are significant. We could refit the model with only these three or run stepwise/best subsets, but we will not do so here.
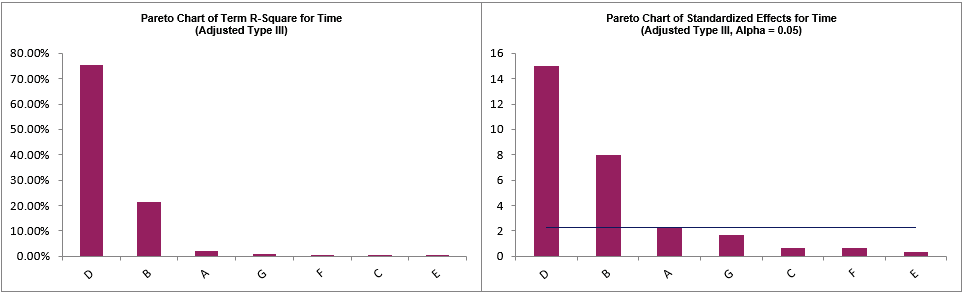
The Pareto Charts of Term R-Square and Standardized Effects are given:
Click on Sheet Plots to View the Main Effects Plots:
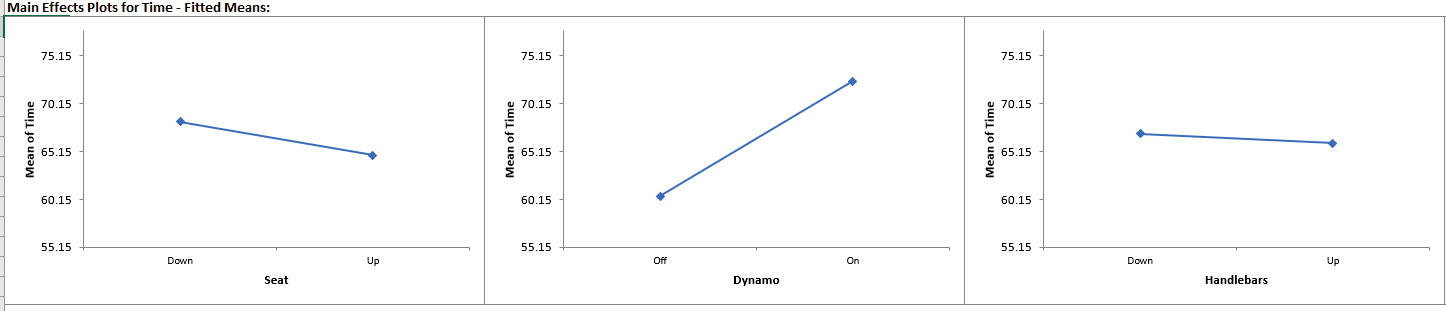
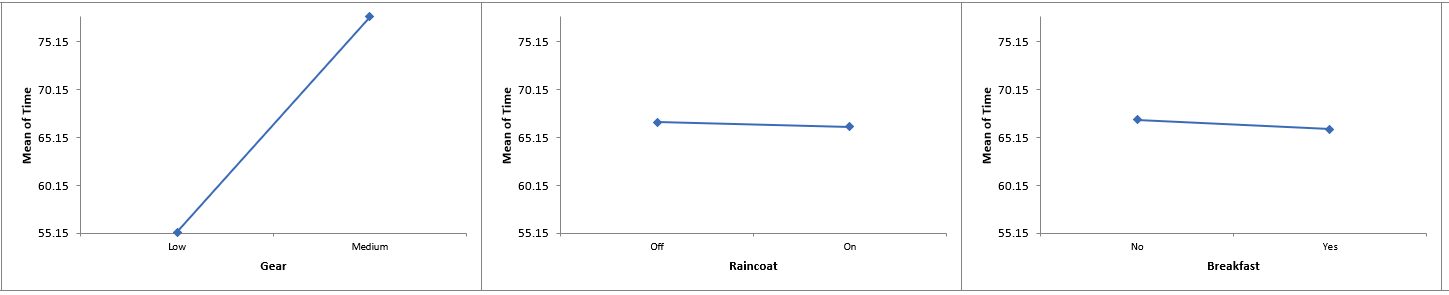
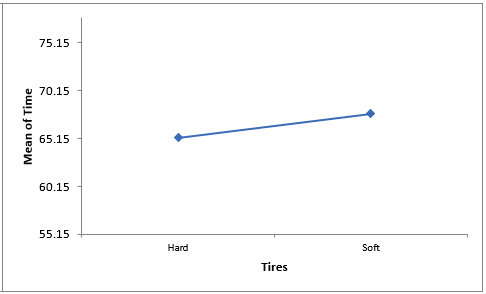
Hovering the cursor on the Main Effects Plots for Dynamo we see that Mean Time increases from 60.5 to 72.5 seconds when Dynamo is On, so Dynamo is adding 12 seconds to the hill climb time. The Mean Time increases from 55.25 to 77.75 for Gear Low to Medium, so Gear is adding 22.5 sec to the time. These Main Effects can also be calculated by doubling the term coefficient values.
Given that Gear is the dominant factor and that the experimenter suspected that Gear might interact with other factors, a single column foldover design was carried out to remove aliasing from the Gear term.
Click on sheet BHH Bicycle 1 in BHH Bicycle.xlsx.
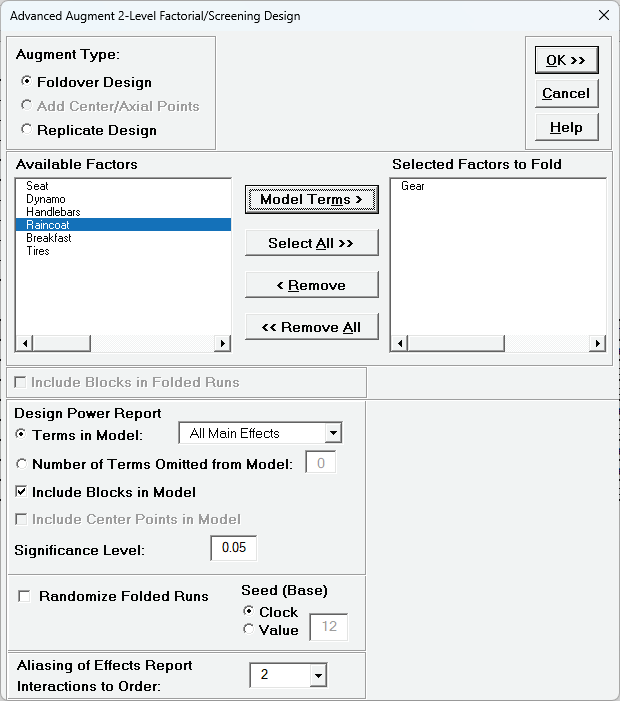
Click SigmaXL > Design of Experiments > Advanced Design of Experiments: Augment 2-Level Factorial/Screening > Augment Design Select Gear and click Model Terms as shown. Use the default settings for Design Power Report. Uncheck Randomize Folded Runs.
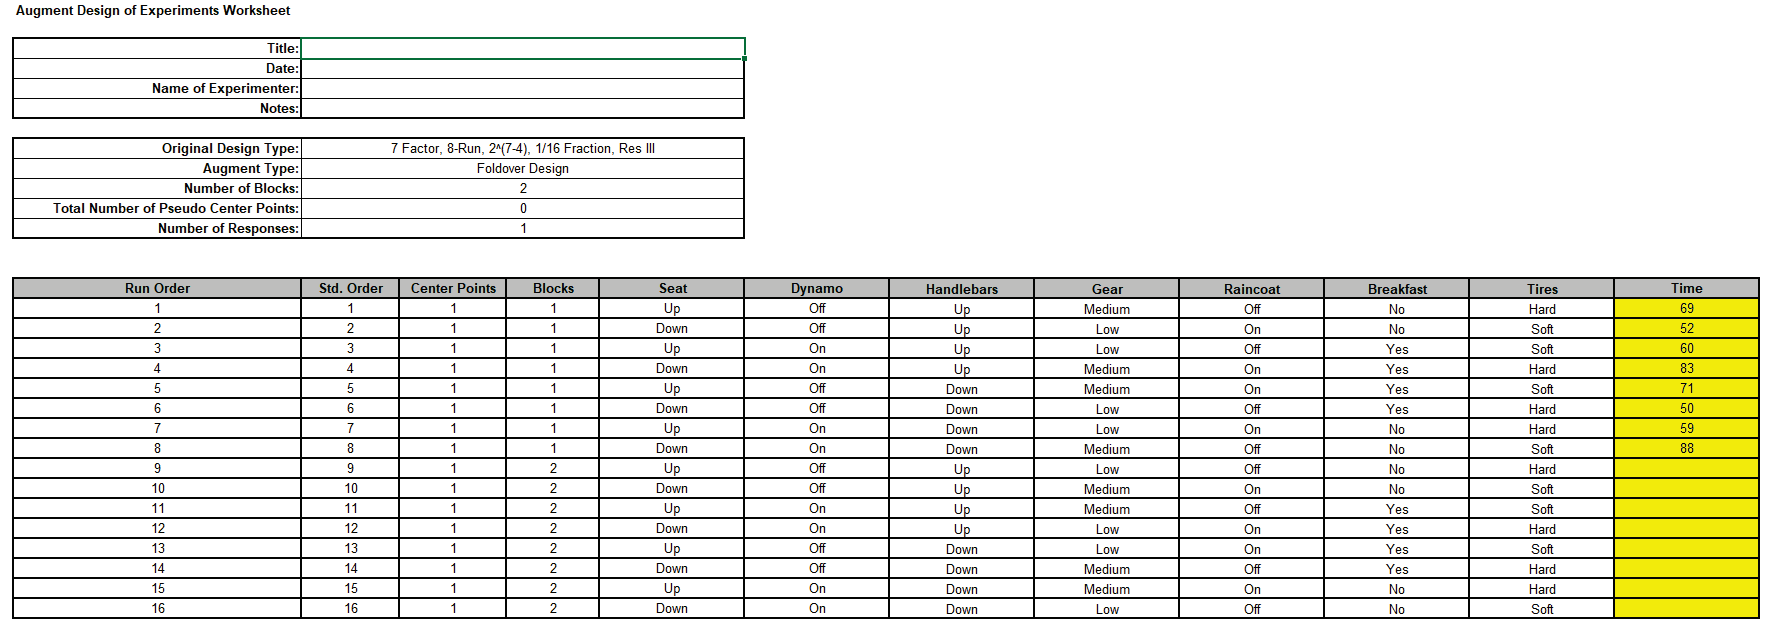
Click OK. The worksheet augments the original fractional factorial design with 8 new runs as a block, where the Gear column is folded and all of the other columns are unchanged.
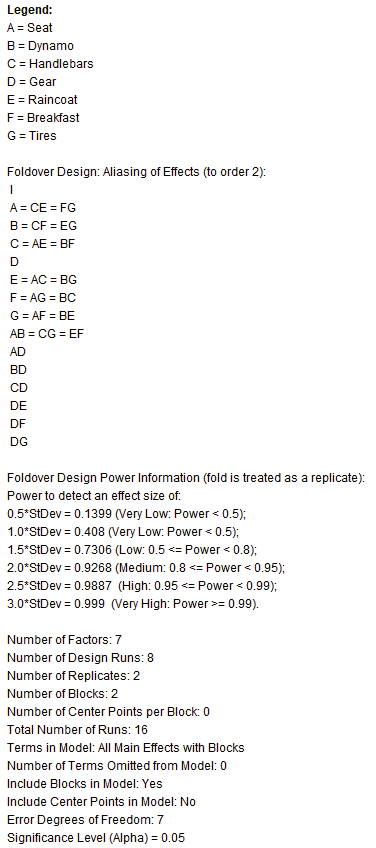
Note that for Factor D, Gear, the main effect is free and clear of any aliasing with two-way interactions and two-way interactions involving D are free and clear of other two-way interactions. However, the other main effects are still aliased with two-way interactions. Using a single column foldover design effectively produces a hybrid Resolution III and V design.
This design has medium power to detect an effect size = 2.0*StDev (using All Main Effects with Blocks model with error degrees of freedom = 7).
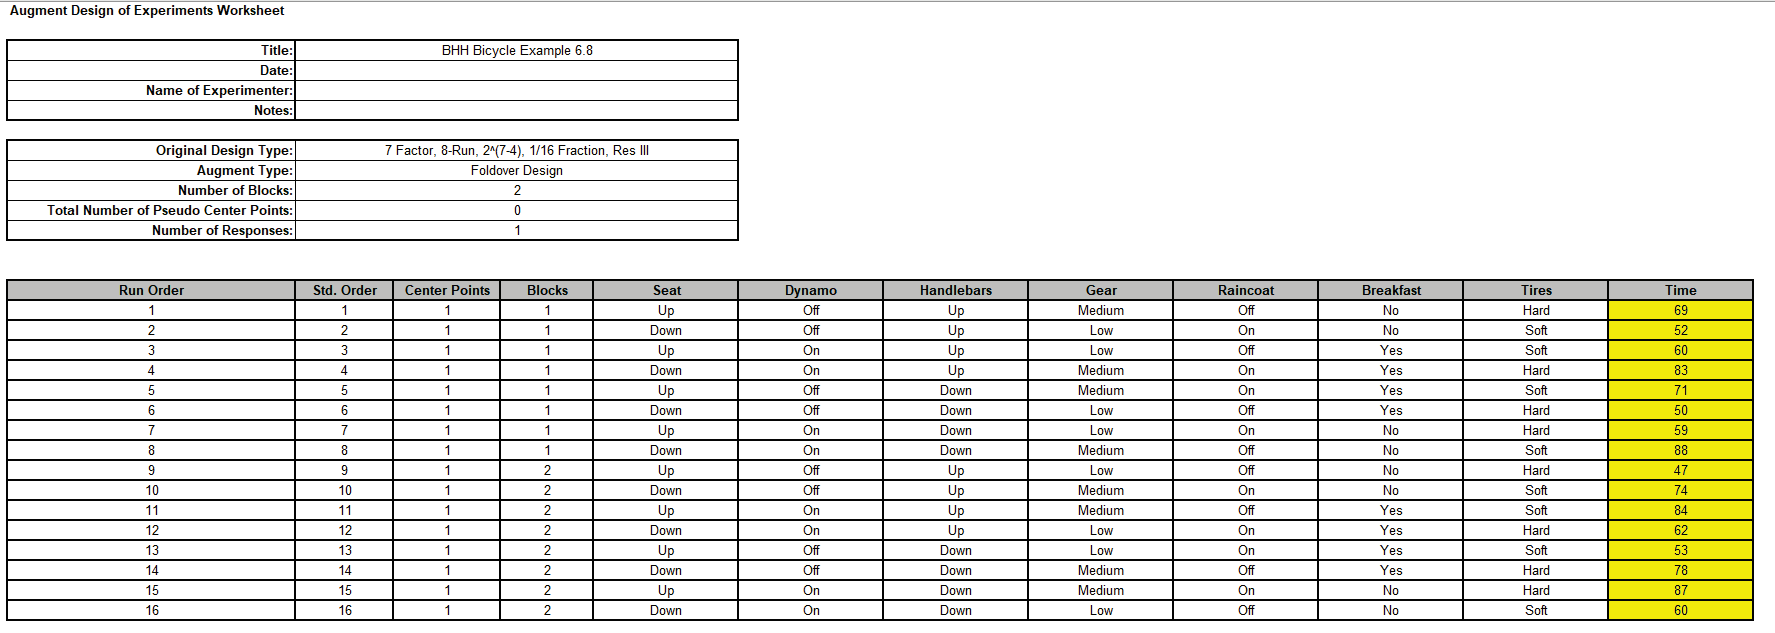
Click on sheet BHH Bicycle 2 in BHH Bicycle.xlsx. This has the augmented design worksheet populated with Time values.
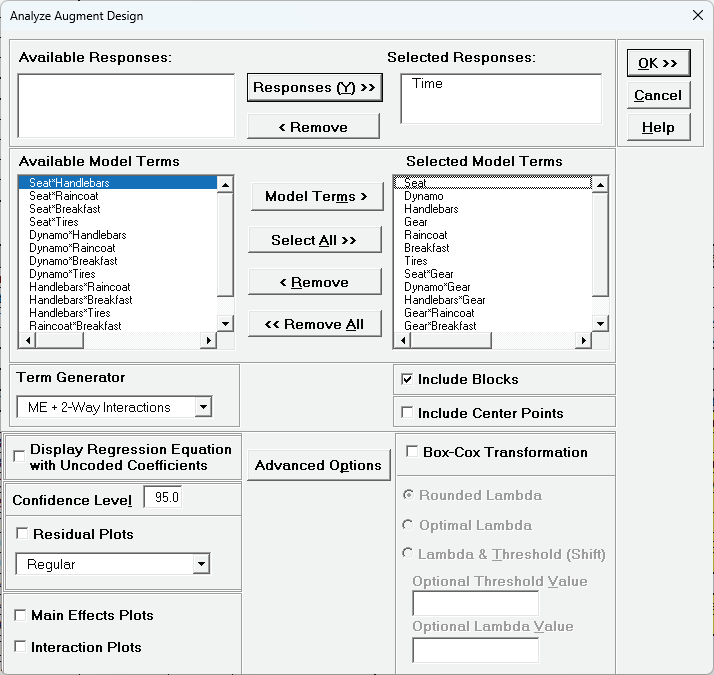
Click SigmaXL > Design of Experiments > Advanced Design of Experiments: Augment 2-Level Factorial/Screening > Analyze Augmented Design.
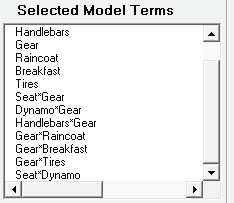
Select Responses and Model Terms as shown with Term Generator as ME + 2-Way Interactions. Using the Model Terms > button, select the seven main effects: Seat to Tires and the six two-way interactions involving Gear: Seat*Gear, Dynamo*Gear, Handlebars*Gear, Gear*Raincoat, Gear*Breakfast, and Gear*Tires. Finally, select Seat*Dynamo to estimate the aliased interactions AB=CG=EF. Check Include Blocks. With 14 model terms, plus the constant and block term, there will be no degrees of freedom for error, so uncheck Residual Plots Leave Main Effects Plots and Interaction Plots unchecked.
Click ok.
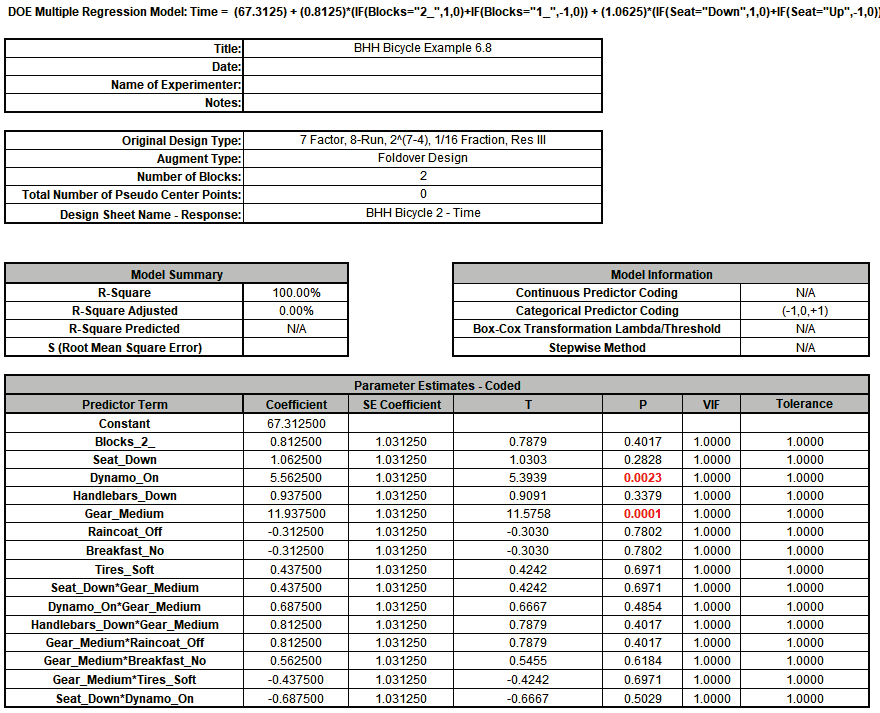
Note that since this is a saturated model, SE Coefficients are computed using Lenth Pseudo Standard Error. P-Values are computed using Monte Carlo simulation with 10000 replications.
Dynamo and Gear are the only significant terms and this is in agreement with Box-Hunter-Hunter:
"The large main effect for factor D (gear) is now estimated free of aliases. Also, as required, all two-factor interactions involving D are free of aliases although for this particular set of data, none of these are distinguishable from noise. In this case, then the tentative conclusions from the first 8 runs appear to be borne out."
The Pareto Charts of Term R-Square and Standardized Effects are given:
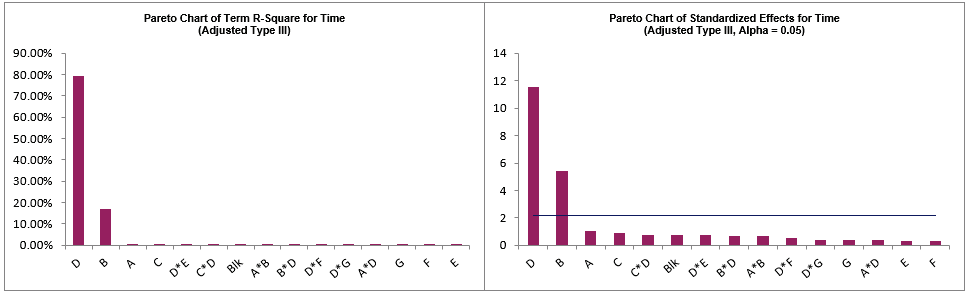
. Now we will refit the model using forward stepwise with criterion AICc.
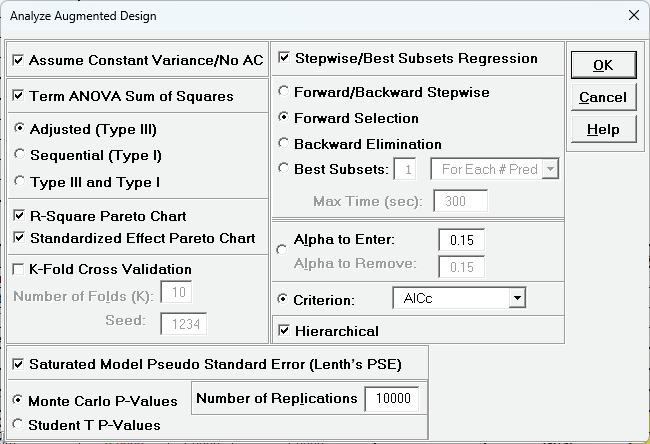
Click Recall SigmaXL Dialog menu or press F3 to Recall Last Dialog. Click Advanced Options Check Stepwise/Best Subsets Regression, select Forward Selection, Criterion: AICc, click OK.
Click ok. Click ok.
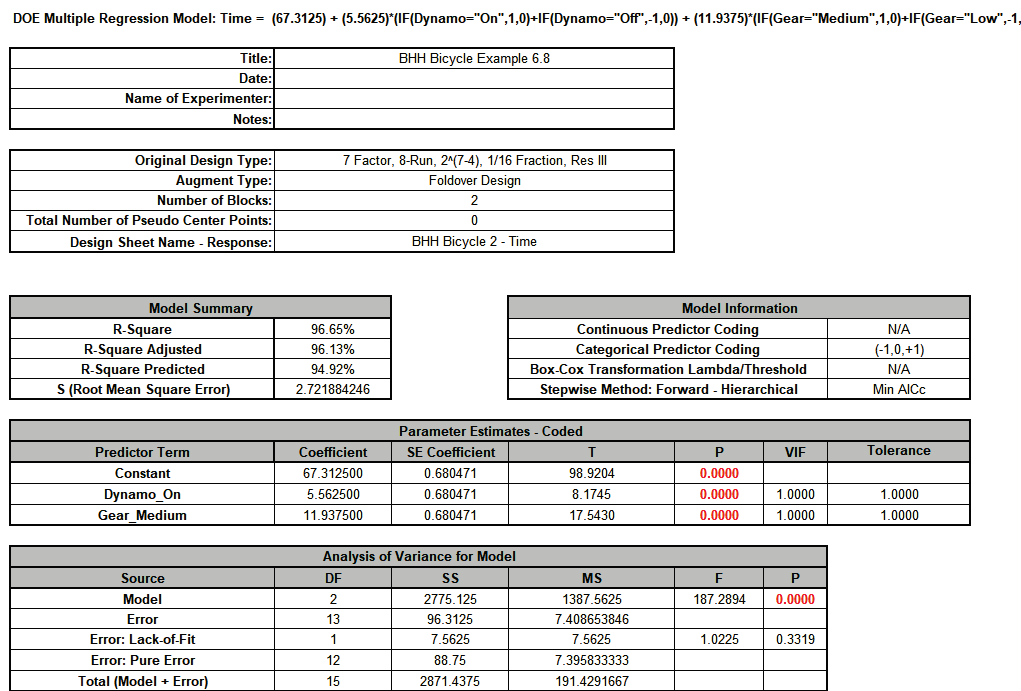
The stepwise model reduces to just the Dynamo and Gear term with a very good R-Square = 96.7% and R-Square Predicted = 94.9%. We could refit to look at Residuals but we will not do so here.
Scroll to the Predicted Response Calculator. Set Goal to Minimize.
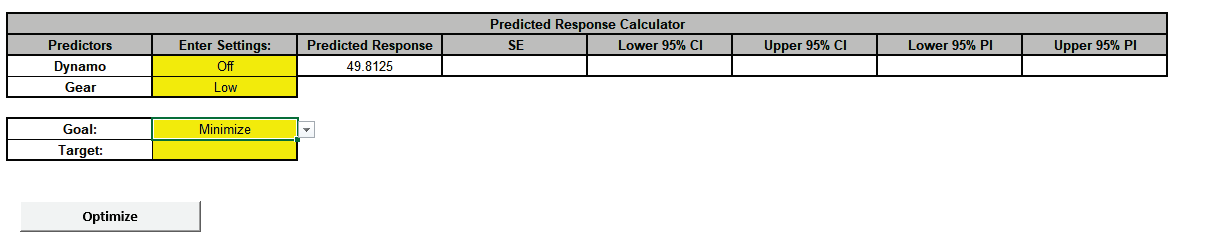
The default reference values of Dynamo = “Off” and Gear = “Low” are the minimum time settings but we will run Optimize anyway, since it is rarely the case that the default settings give an optimum.
Click Optimize.
Click Yes.

The predicted hill climb time is approx. 50 seconds with a confidence interval of 47.3 to 52.4 sec.


