ANOM Normal Two-Way (With Main Effects and Slice Charts)
We will look at two balanced examples from the ANOM book
(used with author permission),
one with no interaction and another with a strong interaction,
and then a slightly unbalanced
version of the latter (Wludyka, 2013).
Open ANOM Examples.xlsx, click on
Hemoglobin Normal tab. This data is from a factorial
design to study hemoglobin levels in males (Example 5.1). The factors are
Therapy (Chemo or
Radiation) and Drug (Type 1, 2, 3).
Ensure that the entire data table is selected. If not, check Use Entire Data
Table.
Click SigmaXL > Graphical Tools >
Analysis of Means (ANOM) > ANOM Normal Two-Way.
Ensure that the entire data table is selected. If not, check Use
Entire Data Table.
Click Next.
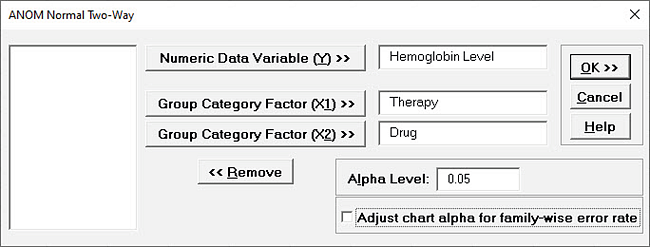
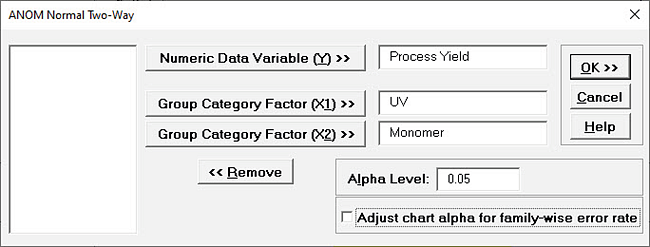
Select Hemoglobin Level, click Numeric Data Variable (Y)
>>; select Therapy, click Group Category Factor (X1)
>>; select Drug,
click Group Category Factor (X2) >>.
Alpha Level = 0.05, Adjust chart alpha for family-wise error rate is
unchecked:
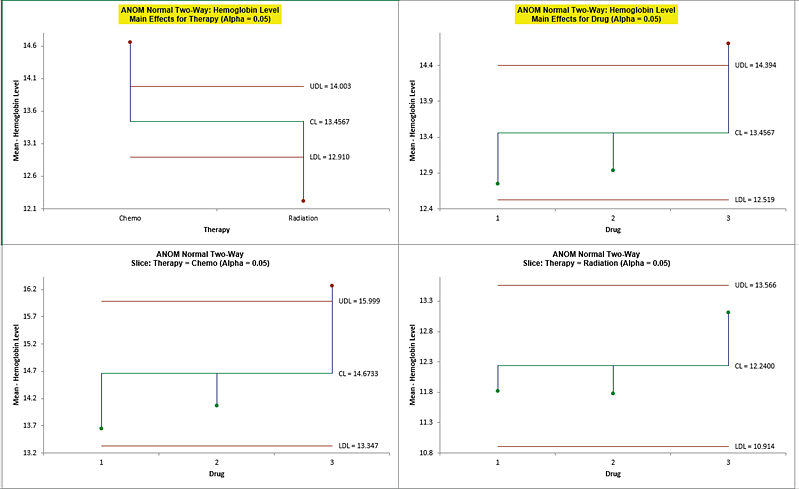
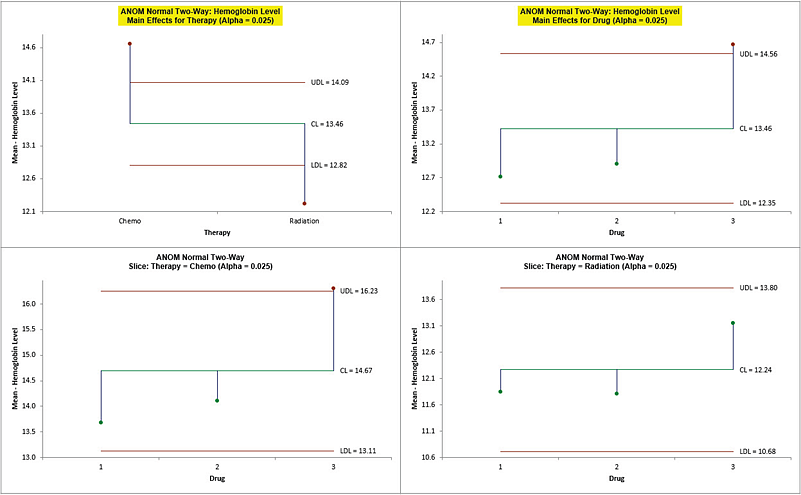
Click OK. The ANOM Normal Two-Way Main
Effects, Slice charts and Interaction plots are
shown below:
Since the Interaction is not significant (P-Value is >= 0.1), the Main Effects charts
are highlighted.
The decision limits match the manual calculations given in the ANOM book (pages 87, 88).
Since the average hemoglobin level for radiation falls below the lower decision limit,
and the average for chemotherapy falls above the upper decision limit, therapy has an (α
= 0.05) effect.
There is also an effect on hemoglobin level due to the drug since the average hemoglobin
level for drug 3 is above the upper decision line.
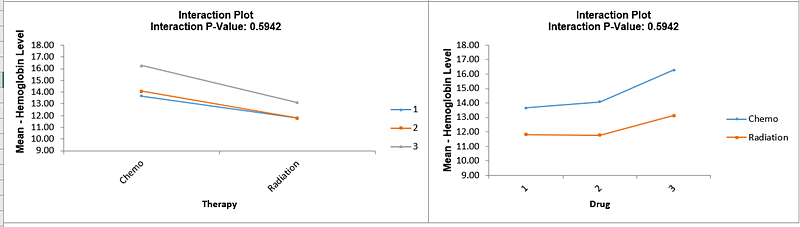
Tip: Two-Way ANOM Normal is complementary to Two-Way ANOVA.
Analyzing the above data
using Two-Way ANOVA shows that Therapy is significant with a
P-Value = 0.0001, Drug is also
significant with a P-Value = 0.0105 and the Interaction is not
significant, with a P-Value = 0.5942.
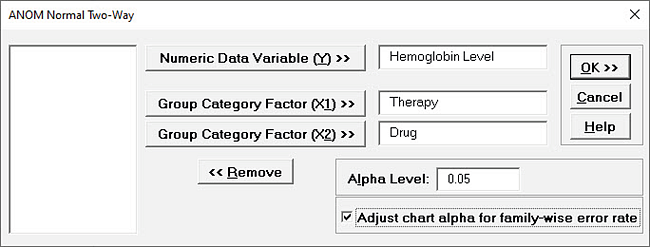
Click Recall SigmaXL Dialog menu or press
F3 to Recall Last Dialog.
Check Adjust chart alpha for family-wise error rate.
This will apply a Bonferroni correction to the specified alpha values to control the
overall family-wise error rate for the charts.
So, the Main Effects alpha will be = 0.05/2 = 0.025 and the Slice Charts alpha will be =
0.05/2 = 0.025 as well.
Click OK.
The ANOM Normal Two-Way Main Effects and Slice charts are shown below:
With the Bonferroni corrected alpha of 0.025, the significant results do not change, but
they are closer to the decision lines.
The trade-off for this chart family-wise adjustment is loss of power.
In ANOM Examples.xlsx, click on Process Yield Normal
tab.
This data is from a factorial design to study the effect of three monomers and two
levels of UV exposure (1 = UV; 2 = No UV) on the percent yield for contact lens
production (Example 5.3).
Click SigmaXL > Graphical Tools > Analysis of Means (ANOM) > ANOM
Normal Two-Way.
Ensure that the entire data table is selected. If not, check Use Entire Data
Table.
Click Next.
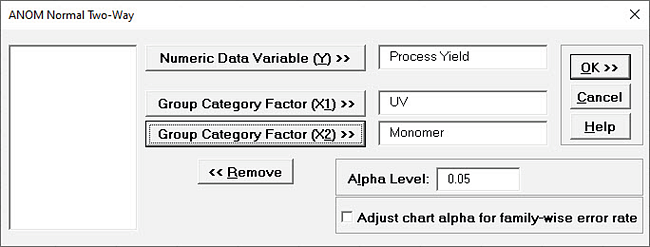
Select Process Yield, click Numeric Data Variable (Y)
>>; select UV, click Group Category Factor (X1)
>>; select Monomer, click Group Category Factor (X2)
>>.
Alpha Level = 0.05, Adjust chart alpha for family-wise error rate is
unchecked:
Click OK.
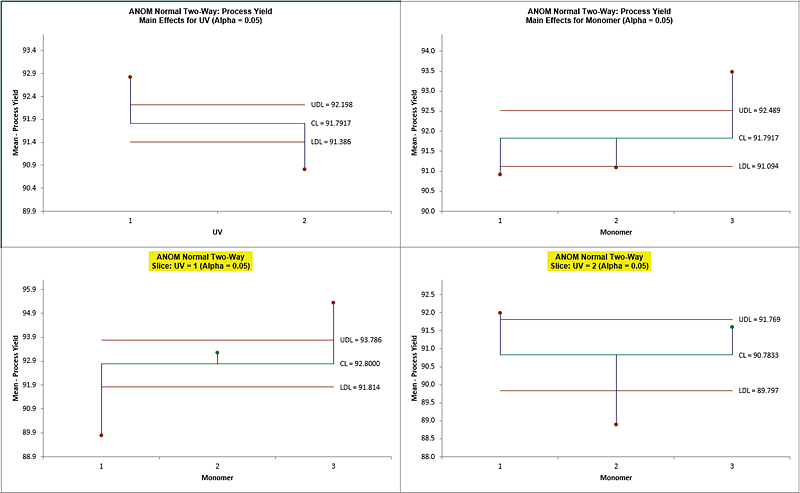
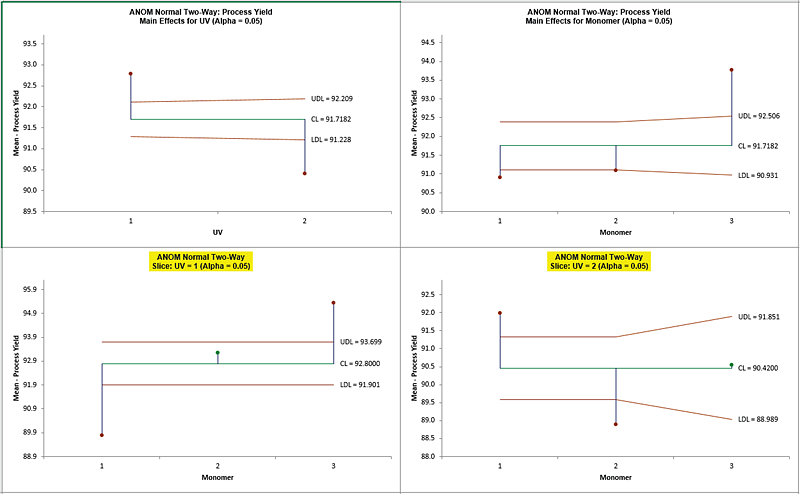
The ANOM Normal Two-Way Main Effects, Slice charts and Interaction plots are shown
below:
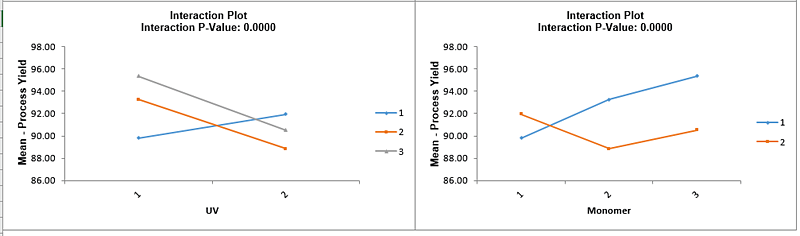
Since the Interaction P-Value is < 0.1, the Slice charts are highlighted.
The decision limits for the Slice charts match the calculations given in Wludyka (2013).
See Appendix References for Analysis of Means (ANOM)
Charts.
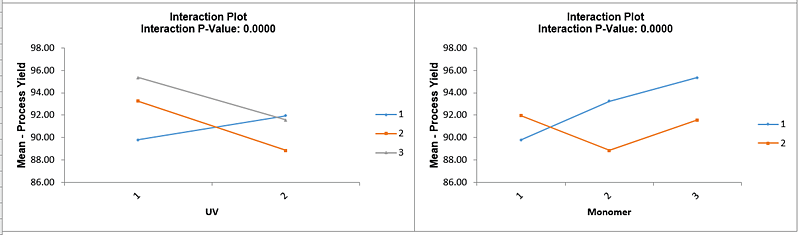
The Slice plot clearly shows the effect of the strong interaction.
When UV = 1 (UV Exposure), the three monomers differ.
In particular, the average for monomer 1 is below the overall average and the average
for monomer 3 is above the overall average.
However, for UV = 2 (no UV), the monomers also differ but in an entirely different
manner than in the UV = 1 case, revealing the nature of the interaction.
Tip: As previously noted, Two-Way ANOM Normal is complementary to
Two-Way ANOVA.
Analyzing the above data using Two-Way ANOVA shows that UV is significant with a P-Value
= 0.0001, Monomer is significant with a P-Value = 0.0000 (4.4 e-5) and the Interaction
is also significant, with P-Value = 0.0000 (2.2e-6).
In ANOM Examples.xlsx, click on Process Yield Normal Unbal tab.
This data is from a factorial design to study the effect of three monomers and two
levels of UV exposure (1 = UV; 2 = No UV) on the percent yield for contact lens
production, but two of the observations are missing for A = 2 (no UV) and B = 3 (monomer
3).
Click SigmaXL > Graphical Tools > Analysis of Means (ANOM) > ANOM
Normal Two-Way.
Ensure that the entire data table is selected. If not, check Use Entire Data
Table.
Click Next. Select Process Yield, click Numeric Data Variable
(Y) >>; select UV, click Group Category Factor (X1)
>>; select Monomer, click Group Category Factor (X2)
>>.
Alpha Level = 0.05, Adjust chart alpha for family-wise error rate is
unchecked:
Click OK. The ANOM Normal Two-Way Main Effects,
Slice charts and Interaction plots are shown below:
The significant results of the experiment have not changed, but the decision limits are
now varying due to the unbalanced data and use critical values for unbalanced data.
The decision limits for the Slice charts match the calculations given in Wludyka (2013).