How Do I Perform ANOM Levene Robust Variances Test in Excel Using SigmaXL?
The ANOM Levene Robust Variances chart is complementary to Levene's Test for Equal Variance
and is also available as an option in the Levene's Test dialog. Since it uses absolute
deviations from the median, it is robust to the assumption of normality.
Open Customer Data.xlsx, click on
Sheet 1 tab.
Click SigmaXL > Graphical Tools > Analysis of Means
(ANOM) > ANOM Levene Robust
Variances. Ensure that the entire data table is
selected. If not, check Use Entire Data Table.
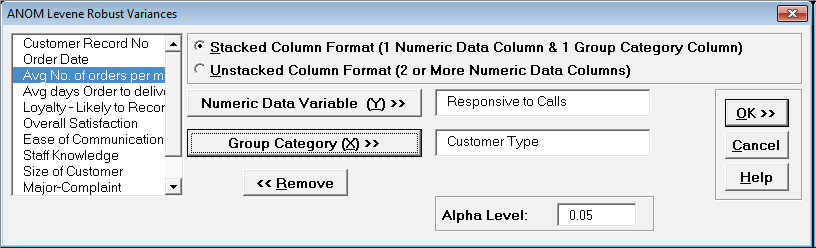
Click Next. Ensure that Stacked
Column Format is checked. Select Responsive to
Calls, click Numeric Data Variable (Y) >>; select
Customer Type, click Group Category (X) >>;
Set Alpha
Level = 0.05.
We are analyzing the same nonnormal data used in Levene's Test
for Equal Variances.
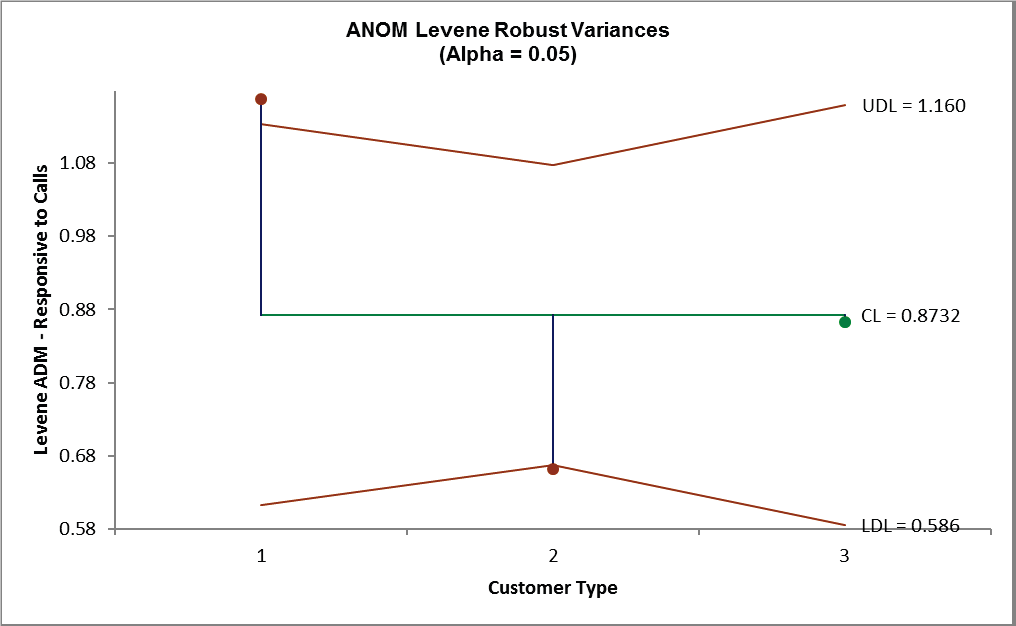
Click OK. The ANOM Levene Robust Variances chart is
displayed:
The ANOM chart clearly shows Customer
Type 1 has significantly higher variance (ADM) than
overall and Customer Type 2 has significantly lower variance.
The varying decision limits are due to
the varying sample sizes for each Customer Type, with
smaller sample size giving wider limits in a manner similar to a
control chart. If the data are
balanced the decision limit lines will be constant.