How Do I Perform ANOM Binomial Proportions Two-Way in Excel Using SigmaXL?
The ANOM Levene Robust Variances chart is complementary to Levenes Test for Equal Variance
and is also available as an option in the Levenes Test dialog. Since it uses absolute
deviations from the median, it is robust to the assumption of normality.
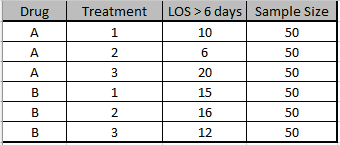
Open ANOM Examples.xlsx, click on the Length of Stay -
Binomial Prop tab. This is hospital
length of stay (LOS > 6 days) after bypass surgery. The data is
from a factorial design with
Factors: Drug (A, B) and Treatment (1, 2, 3). (Example 5.15 from
the ANOM book used with
author permission).
Click SigmaXL > Graphical Tools > Analysis of Means
(ANOM) > ANOM Binomial Proportions
Two-Way. Ensure that the entire data table is selected. If not, check
Use Entire
Data Table.
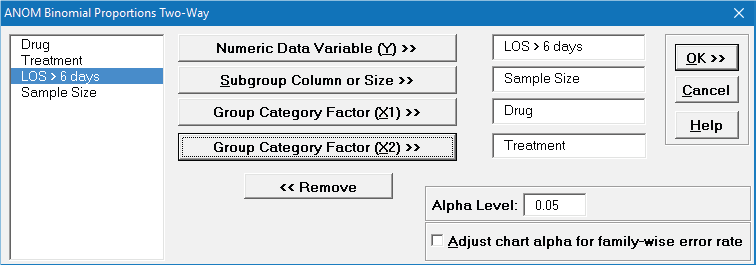
Click Next. Select
LOS > 6 days, click Numeric Data Variable (Y) >>;
select Sample Size, click Subgroup Column or Size >>;
select Drug, click
Group Category Factor (X1) >>; select Treatment, click
Group Category Factor (X2) >>.
Alpha Level = 0.05, Adjust chart alpha
for
family-wise error rate is unchecked:
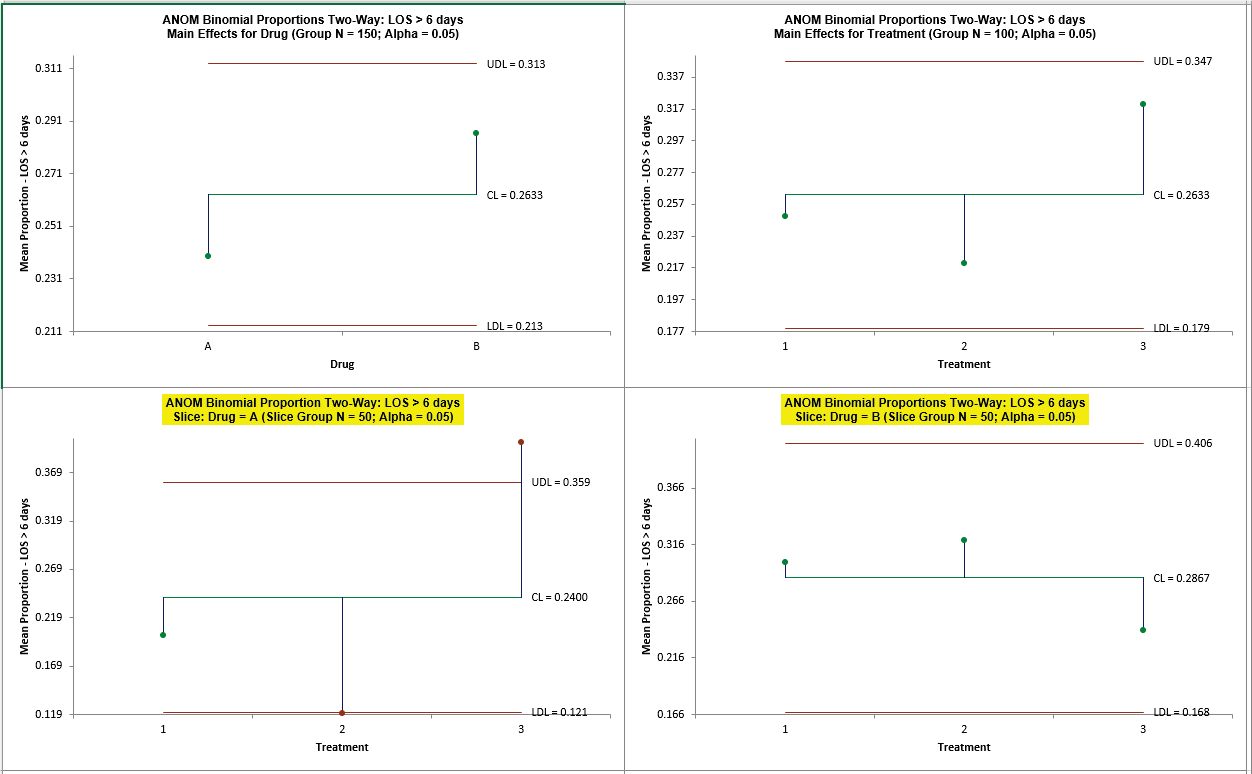
Click OK. The ANOM Binomial Proportions
Two-Way Main Effects, Slice charts and Interaction
plots are shown below:
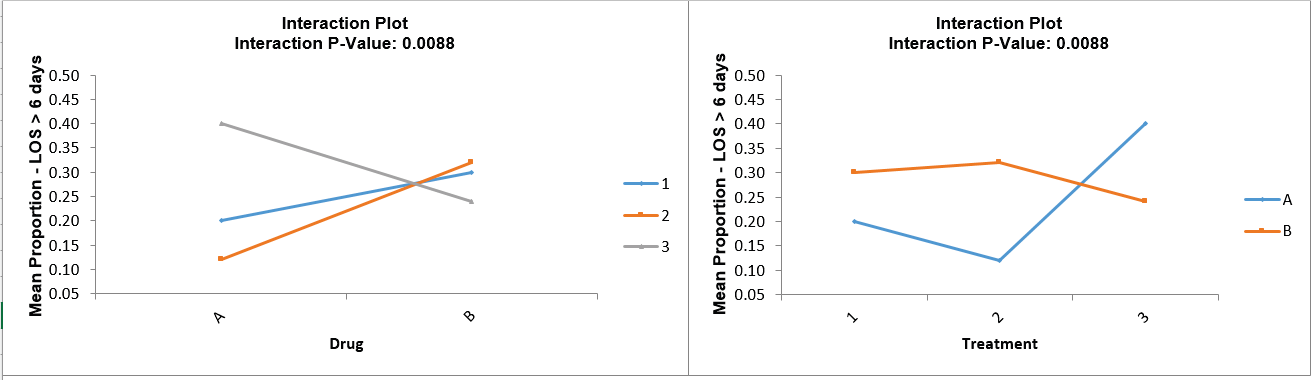
Since the Interaction P-Value is < 0.1 (automatically determined
from Logistic regression), the
Slice charts are highlighted. The Slice plot clearly shows the
effect of the strong interaction.
When Drug = A, Treatment 2 results in a significantly lower mean
proportion LOS and
Treatment 3 results in a significantly higher LOS. When Drug =
B, the Treatment does not have
a significant effect on LOS.