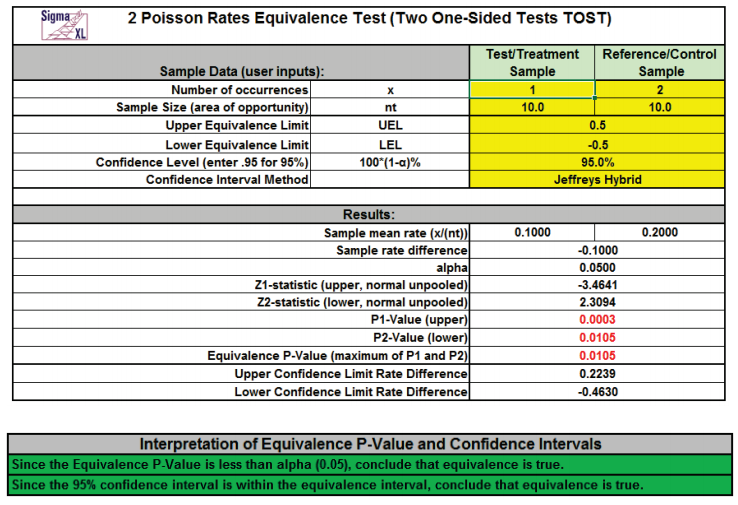
Basic Statistical Templates 2 Poisson Rates Equivalence Test
Click SigmaXL > Templates & Calculators > Basic Statistical Templates
> 2 Poisson Rates Equivalence Test to access the 2 Poisson Rates
Equivalence Test (Two One-Sided Tests TOST)
calculator. The template gives the following default example.
Notes
- Enter summarized Sample Data, Upper & Lower Equivalence Limits and Confidence
Level in
cells with yellow highlight. Do not modify any other part of this worksheet.
- Sample Size (area of opportunity) can be a count, time, length or other unit that
defines the
area of opportunity for an occurrence.
- Select Confidence Interval Method using drop-down.
- Confidence intervals for difference in Poisson rates have an "oscillation"
phenomenon where the coverage probability varies with x and n.
- Jeffreys Hybrid is recommended and has a mean coverage probability that is close
to the specified
confidence interval. (See Li, 2011).
- Normal Approximation will match the P-Value calculations, but should only be
used when the
number of occurrences for each sample is greater than 10.
- Null hypothesis for P1: Rate Difference >= UEL; Null hypothesis for P2: Rate
Difference <= LEL. Both null hypotheses must be rejected to conclude that
equivalence is true. The P-Values are
based on the normal approximation unpooled method.
- LEL and UEL establish the zone or region of equivalence and are determined by what
size rate
difference is considered practically significant.
- Since the Jeffreys Hybrid confidence interval option uses a different method than
the normal
based hypothesis test, it is possible that the conclusion from the Equivalence
P-Value will be
different from that of the confidence interval. In this case, we recommend using
just the
confidence interval method.
- Due to the complexity of calculations, this template uses VBA macros rather than
Excel
formulas. SigmaXL must be initialized and appear on the menu in order for this
template to
function.
References:
Li, H.Q., Tang, M.L., Poon, W.Y. and Tang, N.S. (2011), Confidence intervals for
difference between two Poisson rates, Comm. Stat. Simul. Comput. 40, pp. 14781491.
Przyborowski, J., Wilenski, H., (1940), Homogeneity of results in testing samples from
Poisson series. Biometrika 31, 313323.


