Two Sample Comparison Test in Excel
- Home /
- 2 Sample Comparison Test
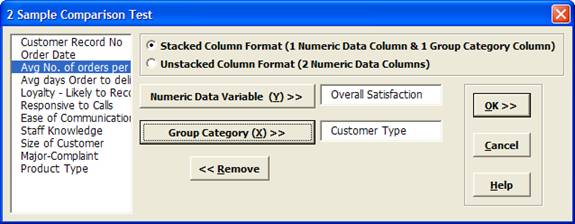
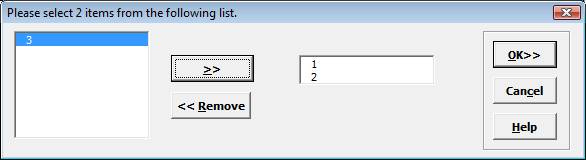
We will now do a full comparison test of Customer Satisfaction for Customer Type 1 and 2. This test checks each sample for normality, equal variance (F-test and Levene's), 2 sample t-test (assuming equal and unequal variance), and Mann Whitney test for equal Medians. Depending on the normality, variance, and sample size results, the appropriate p-values are highlighted in yellow.
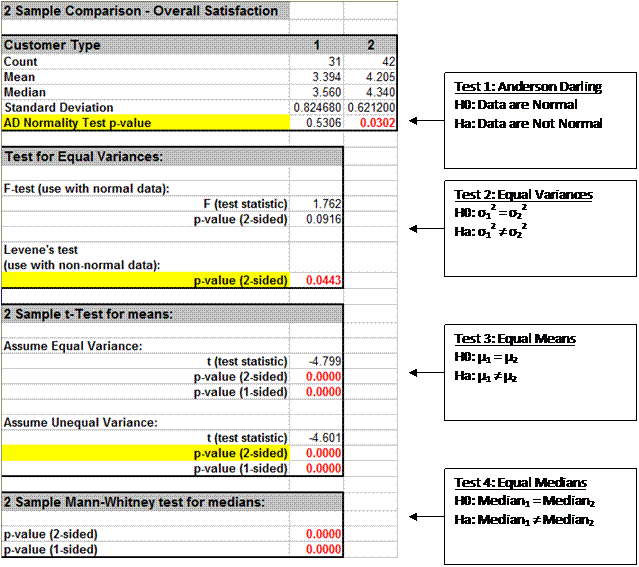
Customer Type 2 has non-normal data. This makes Levene's test the appropriate test for unequal variance. Levene's test indicates that Customer Type 2 has a significantly lower variance, or standard deviation. The lower standard deviation translates to a consistent level of satisfaction.
Since Levene's test indicates unequal variance, the appropriate t-test assumes unequal variance. The t-test indicates that Customer Type 2 has a significantly higher mean satisfaction.
The Two Sample Mann-Whitney test also shows a significant difference in Medians. This test is highlighted when the data are not normal and the sample size is small (as determined by the formulas used in Basic Statistical Templates Minimum Sample Size for Robust t-Tests and ANOVA).
Clearly the next step would be to determine a root cause or best practices to reduce the variability in overall satisfaction and increase the mean for all customer types.