- LIVE HELP IS

How Do I Perform a Two-Way ANOVA in Excel Using SigmaXL?
Two-Way ANOVA tests the following:
H0 (Factor X1): μ1 = μe2 = …= μkHa (Factor X1): at least one pairwise set of means are not equal (μi ≠ μj);
H0 (Factor X2): μ1 = μ2 = …= μk
Ha (Factor X2): at least one pairwise set of means are not equal (μi ≠ μj);
H0 (Interaction): There is no interaction between factors X1 and X2
Ha (Interaction): There is an interaction between factors X1 and X2.
A Two-Way ANOVA analysis will typically have balanced data from a designed experiment, with an equal number of observations for each combination level of X1 and X2. SigmaXL will also accommodate unbalanced data. The minimum requirement is one observation per combination level of X1 and X2. An error message will be produced if this minimum requirement is not met.
- Open Customer Data.xlsx, click on Sheet 1 tab.
- Click SigmaXL > Statistical Tools > Two-Way ANOVA. Ensure that the entire data table is selected. If not, check Use Entire Data Table.
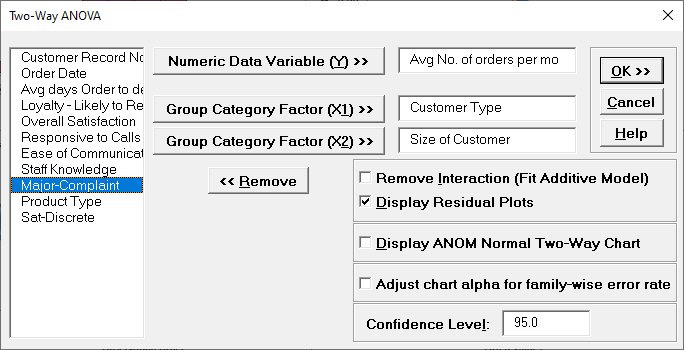
- Click Next. Select
Avg No of Orders per Mo, click Numeric Data Variable (Y) >>; select
Customer Type, click Group Category Factor (X1) >>; select
Size of Customer, click Group Category Factor (X2) >>.
Remove Interaction (Fit Additive Model) should remain unchecked.
Tip: If the Two-Way ANOVA report gives a p-value for the interaction that is high (> 0.1), you should then press F3 or click Recall SigmaXL Dialog to recall this dialog, check Remove Interaction (Fit Additive Model) and rerun the analysis. Display ANOM Normal Two-Way Chart should be unchecked. We will discuss this tool later in Part P – Analysis of Means (ANOM) Charts. Note that this option is only available when Remove Interaction (Fit Additive Model) is unchecked because ANOM Normal Two-Way always includes the interaction term in the model. The ANOM alpha is (100 – Confidence Level)/100).
- Click OK. The results are
shown below:
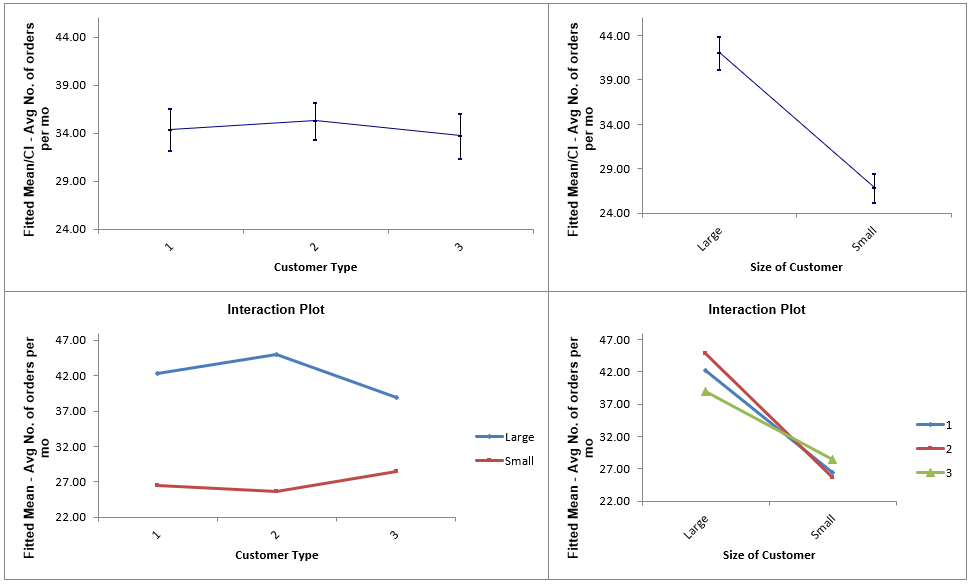
- Scroll down to view the Main Effects (with confidence intervals) and Interaction Plots:
- From the ANOVA table, we can see that the Size of Customer term is significant with a p-value less than .05. Customer Type is not significant by itself, but the Interaction term is significant. This indicates that the effect of Size of Customer on Average Number of Orders per Month depends on Customer Type (we could also equivalently say that the effect of Customer Type depends on Size of Customer).
- This is also confirmed looking at the Main Effects and Interaction plots. Customer Type by itself is not significant. Size of Customer is obviously significant. Looking at the Interaction plot, the different slopes illustrate that the change in Average Number of Orders per Month across Customer Types depends on Customer Size, albeit this is a relatively small effect.
- Click the
Two-Way Residuals sheet to view the residual graphs:
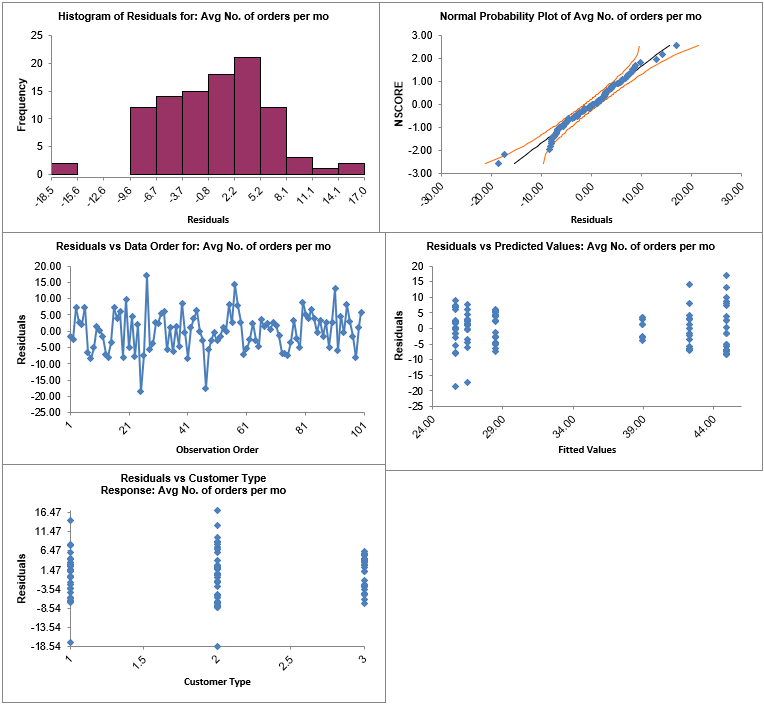
Residuals are the unexplained variation from the ANOVA model (Actual – Predicted/Fitted values). We expect to see the residuals approximately normally distributed with no obvious patterns in the above graphs, which is the case here.
The Residuals versus Size of Customer graph is not shown because Size of Customer is text. In order to display this plot, Size could be coded numerically with 1 = Small and 2 = Large. Simply create a new column called Size-Coded and use the following Excel formula to create the coded values for the first record:
=IF(K2="Small",1,IF(K2="Large",2))
Copy and Paste this formula to obtain coded values for all 100 records. Rerun the Two-Way ANOVA analysis to create the residual graphs
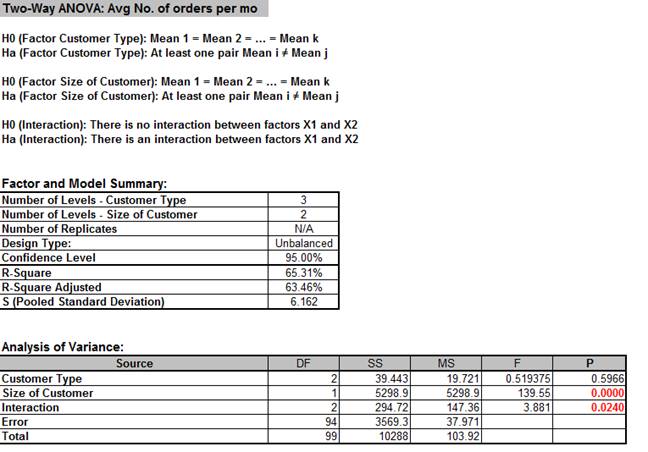
Note that the mean values shown are fitted (predicted least squares) means not data means. This compensates for unbalanced data.
Define, Measure, Analyze, Improve, Control


Simulate, Optimize,
Realize

Web Demos
Our CTO and Co-Founder, John Noguera, regularly hosts free Web Demos featuring SigmaXL and DiscoverSim
Click here to view some now!
Contact Us
Phone: 1.888.SigmaXL (744.6295)
Support: Support@SigmaXL.com
Sales: Sales@SigmaXL.com
Information: Information@SigmaXL.com


