SigmaXL Version
10
Data
Manipulation:
Templates &
Calculators:
-
DMAIC & DFSS Templates
- Team/Project Charter
- SIPOC Diagram
- Data Measurement Plan
- Cause & Effect (Fishbone) Diagram and Quick Template
- Cause & Effect (XY) Matrix with Pareto
- Failure Mode & Effects Analysis (FMEA) with RPN Sort
- Quality Function Deployment (QFD)
- Pugh Concept Selection Matrix
- Control Plan
- Measurement System Analysis (MSA) Templates
- Process Sigma Level - Discrete and Continuous
-
Process Capability & Confidence Intervals
- Tolerance Interval Calculator (Normal Exact)
- DOE Templates
- 2 to 5 Factors
- 2-Level Full and Fractional-Factorial designs
- Main Effects & Interaction Plots
- Taguchi DOE Templates
- Taguchi L8 (2 Level) Three Factor - Robust Cake Example
- Taguchi L8 (2 Level) Four Factor - Catapult Example
- Taguchi L9 (3 Level) Four Factor - Paper Airplane Example
- L4, L8, L9, L12, L16, L18, L27
- Signal-to-Noise Ratios: Nominal is Best, Nominal is Best (Variance Only), Nominal is Best (Mean Square Deviation with Target), Larger is Better, Smaller is Better
- Pareto of Deltas (Effects) and ANOVA SS (Sum-of-Squares) % Contribution (for Main Effects and Two-Way Interactions)
- Main Effects and Interaction Plots
- Control Chart Templates
Graphical Tools:
- Graphical Tool Selection Guide**
- Basic and Advanced (Multiple) Pareto Charts
- EZ-Pivot/Pivot Charts: Easily create Pivot Tables and Charts
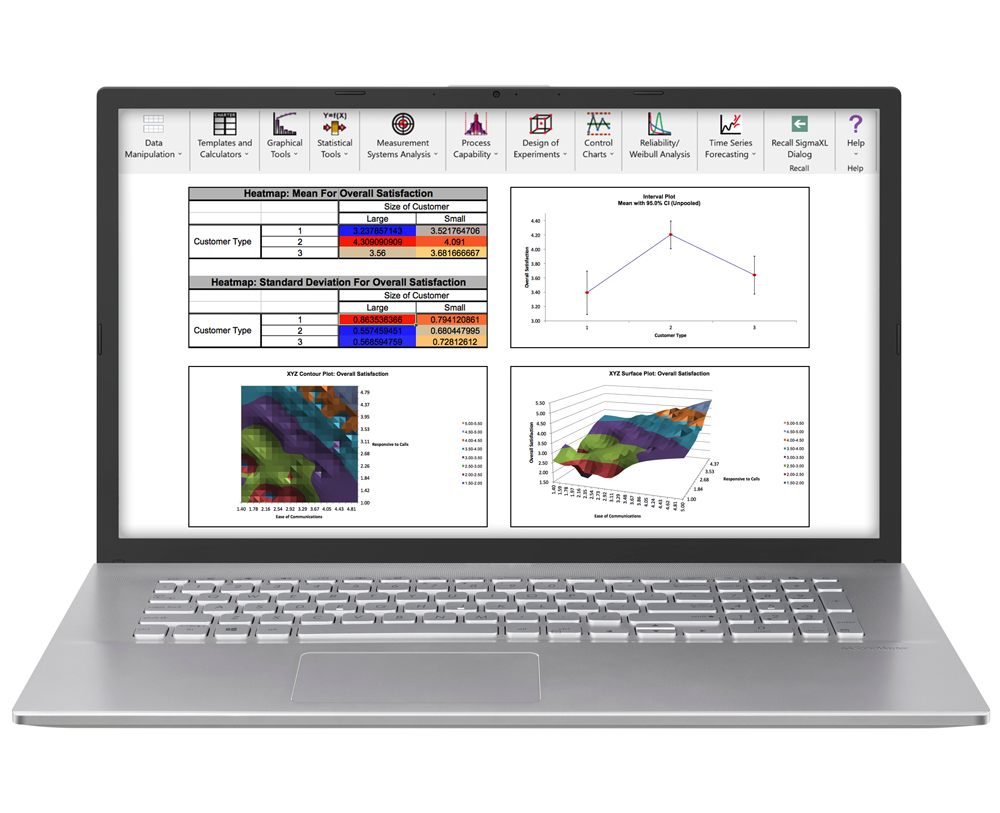
- Heatmap**
-
Basic Histogram
-
Multiple Histograms and Descriptive Statistics (includes
Confidence Interval for Mean and StDev., and Anderson-Darling
Normality Test)
-
Multiple Histograms and Process Capability
(Pp, Ppk, Cpm, ppm, %)
- Multiple Dotplots, Multiple Boxplots,
Multiple X Boxplots
- Interval Plots and Multiple X Interval Plots**
-
Multiple Normal Probability Plots (with 95% confidence intervals
to ease interpretation of normality/non-normality)
- Empirical/Normal CDF Plots**
- Run Charts (with Nonparametric Runs Test allowing you to test for
Clustering, Mixtures, Lack of Randomness, Trends and Oscillation)
-
Overlay Run Chart
-
Multi-Vari Charts
-
Scatter Plots (with linear regression and optional 95% confidence
intervals and prediction intervals)
-
Scatter Plot Matrix
- XYZ Contour/Surface Plot**
-
Analysis of Means (ANOM) Charts
Statistical Tools:
- Equal Variance Tests (Bartlett, Levene and Welch's ANOVA)
- Multiple Comparison of Variances Probability Methods (Post-Hoc): F-Test (with Bonferroni Correction), Levene, Tukey ADM (Absolute Deviation for Medians)
- Welch Multiple Comparison of Means Probability Methods (Post-Hoc): Welch Pairwise, Games Howell
- Correlation Matrix (Pearson and Spearman's Rank Correlation)
- Automatic normality check for correlation utilizing the powerful Doornik-Hansen bivariate normality test
- Yellow highlight to recommend significant Pearson or Spearman correlation - Pearson is highlighted if the data are bivariate normal, otherwise Spearman is highlighted
- General Linear Model**:
Extends Advanced Multiple Regression to include:
- Fixed and Random Factors
- Nested Factors
- Covariates (can be Nested)
- For Random or Mixed Random/Fixed Factors with a balanced design, the ANOVA and Variance Components (VC) report is given based on Expected Mean Squares. VC confidence intervals using Restricted Maximum Likelihood (REML) are included.
- If the design is unbalanced or model is non-hierarchical, REML is used to compute the VC values and confidence intervals. Fixed Effects Tests are based on Satterthwaite approximation degrees of freedom.
- Main Effects with Confidence Intervals and Interaction Plots of Fitted Means for Non-Nested Fixed Factors
- Tukey and Fisher Pairwise Comparison of Means for Non-Nested Fixed Factors
- Predicted Response Calculator
- Multiple Response Optimization for Nested or Non-Nested Fixed Factors
- Advanced Multiple Regression:
- Standardization and coding of continuous predictors
- Option to display regression equation with unstandardized coefficients
- (1, 0) or (-1,0,+1) coding of categorical predictors
- Box-Cox Transformation
- Specify confidence level
- Residual Plots (Regular, Standardized, Studentized – Deleted t)
- Main Effects and Interaction Plots (Fitted Means)
- Contour and Surface Plots
- Optimization with optional constraints
- Automatic removal of extreme VIF or collinear terms (with alias and removal report)
- Specify interactions, quadratic and higher orders (all interactions or up to 3-Way)
- ANOVA Type I and/or Type III Sum-of-Squares with Pareto of Percent Contribution and Standardized Effects
- Lenth Pseudo Standard Error for Saturated Models (Orthogonal or Non-Orthogonal) with Monte Carlo or Student T P-Values
- Specify Test/Withhold Sample for R-square Test & StDev Test Validation
- R-Square Predicted (Leave-One-Out Cross Validation)
- R-Square K-Fold & StDev K-Fold (K-Fold Cross Validation)
- Test for Constant Variance: Breusch-Pagan. Anderson-Darling Normality test is applied to residuals in order to automatically select Normal or Koenker (Robust) version. Report includes the Overall test and Individual predictors as well.
- White robust standard errors for non-constant variance (Heteroskedasticity-Consistent)
- Durbin-Watson test for autocorrelation in residuals with P-Values
- Newey-West robust standard errors for non-constant variance with autocorrelation (Heteroskedasticity and Autocorrelation-Consistent)
- White or Newey-West automatically selected based on Durbin-Watson P-Values
- Stepwise/Best Subsets Regression:
- Forward/Backward with alpha-to-enter, alpha-to-remove
- Forward Selection with alpha-to-enter
- Backward Elimination with alpha-to-remove
- Forward, Backward Criterion: Minimize AICc, BIC; Maximize R-Square Adjusted, R-Square Predicted, R-Square K-Fold
- Best Subsets utilizes the powerful MIDACO Solver (Mixed Integer Distributed Ant Colony Optimization) to solve best subsets with up to hundreds of continuous or categorical variables, including interactions and higher order terms. This feature gives SigmaXL a significant advantage over competitors with Best Subsets limited to 30 continuous variables.
- Best Subsets Criterion: Minimize AICc, BIC; Maximize R-Square Adjusted
- Hierarchical option
- Detailed report with additional statistics such as Condition Number and Mallows’ Cp.
- Box-Tidwell Test and Power Transformation Recommendation for Continuous Predictors (New in Version 10.02) **
- Multiple Linear Regression:
- Accepts continuous and/or categorical (discrete) predictors
- Interactive Predicted Response Calculator with 95% Confidence
Interval and 95% Prediction Interval
- Residual Plots: histogram, normal probability plot, residuals vs.
time, residuals vs. predicted and residuals vs. X factors
- Residual types include Regular, Standardized, Studentized (Deleted
t) and Cook's Distance (Influence), Leverage and DFITS
- Highlight of significant outliers in residuals
- Durbin-Watson Test for Autocorrelation in Residuals with p-value
- ANOVA report for categorical predictors
- Pure Error and Lack-of-Fit report
- Collinearity Variance Inflation Factor (VIF) and Tolerance report
- Fit Intercept is optional
- Binary and Ordinal Logistic Regression:
- Powerful and user-friendly logistic regression.
- Report includes a calculator to predict the response event
probability for a given set of input X values
- Categorical (discrete) predictors can be included in the model in
addition to continuous predictors
- Model summary and goodness of fit tests include Likelihood Ratio
Chi-Square, Pseudo R-Square, Pearson Residuals Chi-Square, Deviance
Residuals Chi-Square, Observed and Predicted Outcomes - Percent
Correctly Predicted
- Stored data includes Event Probabilities, Predicted Outcome,
Observed-Predicted, Pearson Residuals, Standardized Pearson
Residuals, and Deviance Residuals
- Power and Sample Size Calculators for:
- Power and Sample Size Chart. Quickly create a graph showing the relationship between Power, Sample Size and Difference
Measurement System Analysis:
- Create Gage R&R (Crossed) Worksheet:
- Generate worksheet with user specified number of parts, operators,
replicates
- Analyze Gage R&R (Crossed)
- ANOVA, %Total, %Tolerance (with upper and/or lower
specifications), %Process, Variance Components, Number of Distinct
Categories
- Gage R&R Multi-Vari and X-bar R Charts
- Confidence Intervals for %Total, %Tolerance, %Process and Standard
Deviations
- Handles unbalanced data
-
Attribute MSA (Binary, Ordinal, Nominal)
Process Capability:
- Capability Combination Report for Nonnormal
Data (Individuals)
- Box-Cox
Transformation (includes an automatic threshold option so that
data with negative values can be transformed)
- Johnson Transformation
- Distributions supported: Half-Normal, Lognormal (2 & 3
parameter), Exponential (1 & 2), Weibull (2 & 3), Beta (2 & 4),
Gamma (2 & 3), Logistic, Loglogistic (2 & 3), Largest Extreme Value,
Smallest Extreme Value
- Automatic Best Fit based on AD p-value
- Nonnormal Process Capability indices:
Z-Score (Cp, Cpk, Pp, Ppk) and Percentile (ISO) Method (Pp, Ppk)
Design of Experiments:
- Generate 2-Level Factorial and
Plackett-Burman Screening Designs
- User-friendly dialog box
- 2 to 19 Factors; 4,8,12,16,20 Runs
- Unique "view power analysis as you design"
- Randomization, Replication, Blocking and Center Points
- Basic DOE Templates
- 2 to 5 Factors, 2-Level Full and Fractional-Factorial designs
- Automatic update to Pareto of Coefficients
- Easy to use, ideal for training
- Main Effects & Interaction Plots
- Contour & 3D Surface Plots
- Response Surface Designs
- 2 to 5 Factors
- Central Composite and Box-Behnken Designs
- Easy to use design selection sorted by number of runs
- Analyze 2-Level Factorial and Plackett-Burman Screening Designs
- Used in conjunction with Recall Last Dialog, it is very easy to
iteratively remove terms from the model
- Interactive Predicted Response Calculator with 95% Confidence
Interval and 95% Prediction Interval.
- ANOVA report for Blocks, Pure Error, Lack-of-Fit and Curvature
- Collinearity Variance Inflation Factor (VIF) and Tolerance report
- Residual plots: histogram, normal probability plot, residuals vs.
time, residuals vs. predicted and residuals vs. X factors
- Highlight of significant outliers in residuals
- Durbin-Watson Test for Autocorrelation
Control Charts:
- Control Chart Selection Guide
- Individuals, Individuals & Moving Range
- X-Bar & R, X-Bar & S
- I-MR-R, I-MR-S (Between/Within)
- P, NP, C, U
- P' and U' (Laney) to handle overdispersion
- Control charts include a report on tests for special causes.
Special causes are also labeled on the control chart data point. Set
defaults to apply any or all of Tests 1-8
- Process Capability report (Pp, Ppk, Cp, Cpk) is available for I,
I-MR, X-Bar & R, X-bar & S charts
- Add data to existing charts for operator ease of use!
- Scroll through charts with user defined window size
- Control Chart Templates: Rare Events
- Control Chart Templates: Time-Weighted
- Control Chart Templates: Trend
- Control Chart Templates: Average Run Length (ARL) Calculators
Reliability/Weibull Analysis:
- Weibull Analysis
- Complete and Right Censored data
- Least Squares and Maximum Likelihood
- Output includes percentiles with confidence intervals, survival
probabilities, and Weibull probability plot
Time Series Forecasting and Control Charts for Autocorrelated Data
** New features in SigmaXL ® Version
10