How Do I Perform a Paired t-Test in Excel Using SigmaXL?
Paired t-Test
- Open the file Dietcola.xlsx. These are the results of a Before and After taste test on sweetness for diet cola. Ten tasters were used and one month elapsed with the cola in warm storage between the before and after results. Do a one sample t-test on the column of differences.
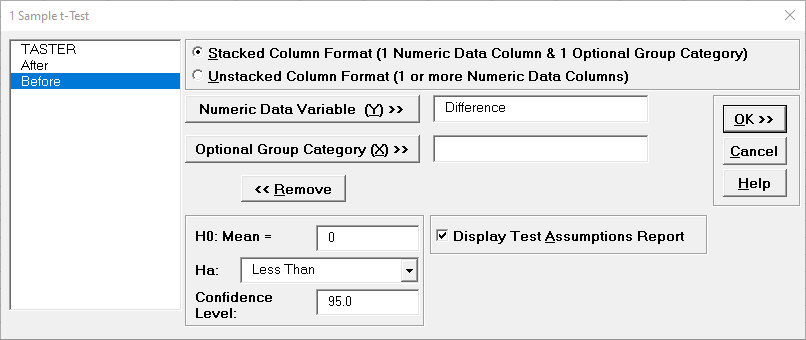
- Click SigmaXL > Statistical Tools > 1-Sample t-test & Confidence Intervals. Ensure that entire data table is selected. If not, check Use Entire Data Table. Click Next. Select Difference, click Numeric Data Variable (Y) >>, set H0: Mean μ= 0, Ha: Less Than (this is a one-sided or one-tail test – sweetness cannot increase). Uncheck Display Test Assumptions Report for now:
- Click OK. Result:
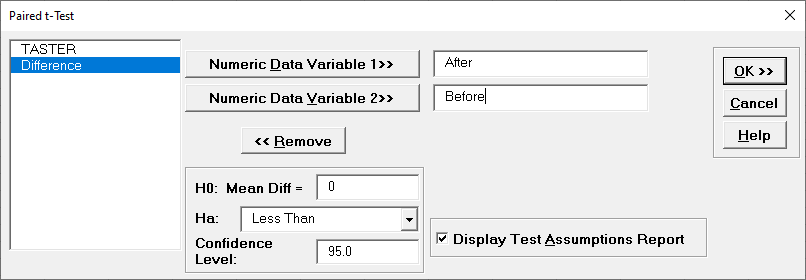
- Now redo the analysis using the paired t-test: Click Sheet 1 Tab; Click SigmaXL > Statistical Tools > Paired t-Test; Click Next; Select After, click Numeric Data Variable 1 >>, select Before as Numeric Data Variable 2 >>, H0: Mean Diff = 0, Ha: Less Than. Check Display Test Assumptions Report.
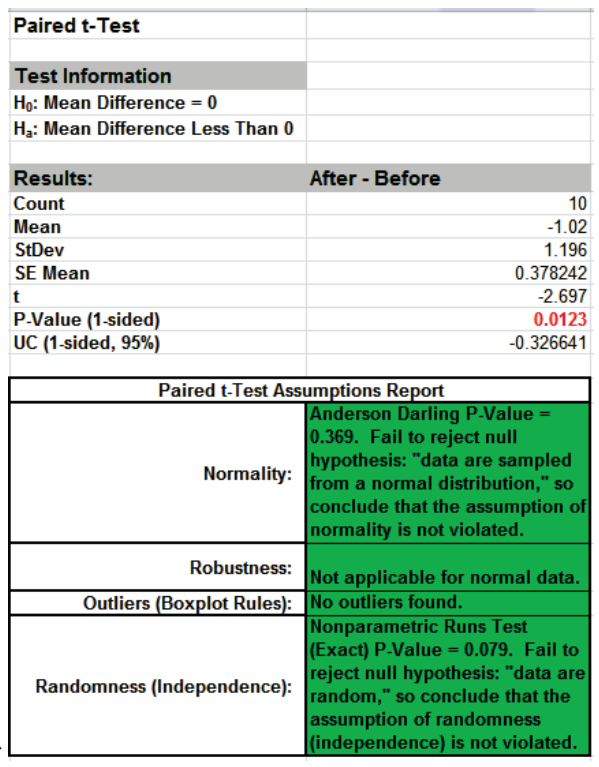
- Click OK. Results are identical to the One sample t-test analysis of difference column, with the added assumptions report showing that all assumptions are met:
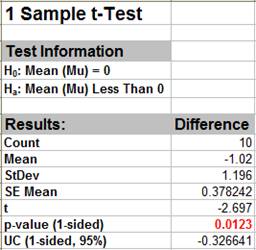
Given the p-value of .012, we reject H0 and conclude that the sweetness has in fact decreased.
Unpaired 2 Sample t-Test vs. Paired t-Test
- Open the Dietcola.xlsx file, click the Sheet 1 tab.
- Click SigmaXL > Statistical Tools > 2 Sample t-test. Ensure that entire data table is selected. If not, check Use Entire Data Table. Click Next.
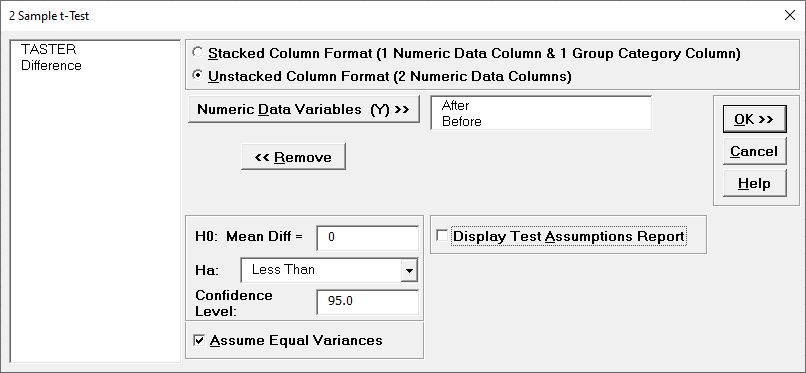
- Check Unstacked Column Format. Select After, Before and click Numeric Data Variables (Y) >>. H0: Mean Diff = 0, Ha: Less Than; check Assume Equal Variances. Uncheck Display Test Assumptions Report:
- Click OK. Results:
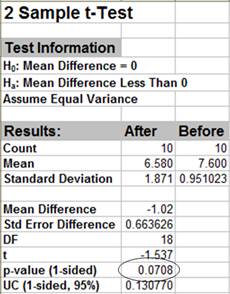
Now the p-value is .07, indicating a fail to reject H0. What changed? Hint: Compare the SE Mean of the Paired t-test to the Std Error Difference of the unpaired two-sample t-test. Where does the additional variability come from in the two-sample t-test? The paired t-test is the appropriate test to use here.
Web Demos
Our CTO and Co-Founder, John Noguera, regularly hosts free Web Demos featuring SigmaXL and DiscoverSim
Click here to view some now!
Contact Us
Phone: 1.888.SigmaXL (744.6295)
Support: Support@SigmaXL.com
Sales: Sales@SigmaXL.com
Information: Information@SigmaXL.com


