- LIVE HELP IS

How Do I Create Overlay Run Charts in Excel Using SigmaXL?
- Click Sheet 1 Tab of Customer Data.xlsx. Click SigmaXL > Graphical Tools > Overlay Run Chart.
- Ensure that entire data table is selected. If not, check Use Entire Data Table. Click Next.
- Select Overall Satisfaction, Responsive to Calls and Ease of Communications. Click Numeric Data Variable (Y) >>.
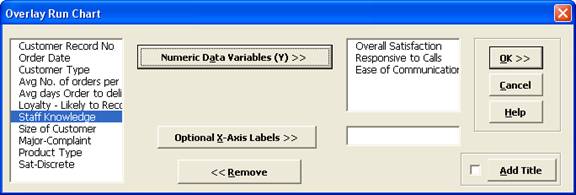
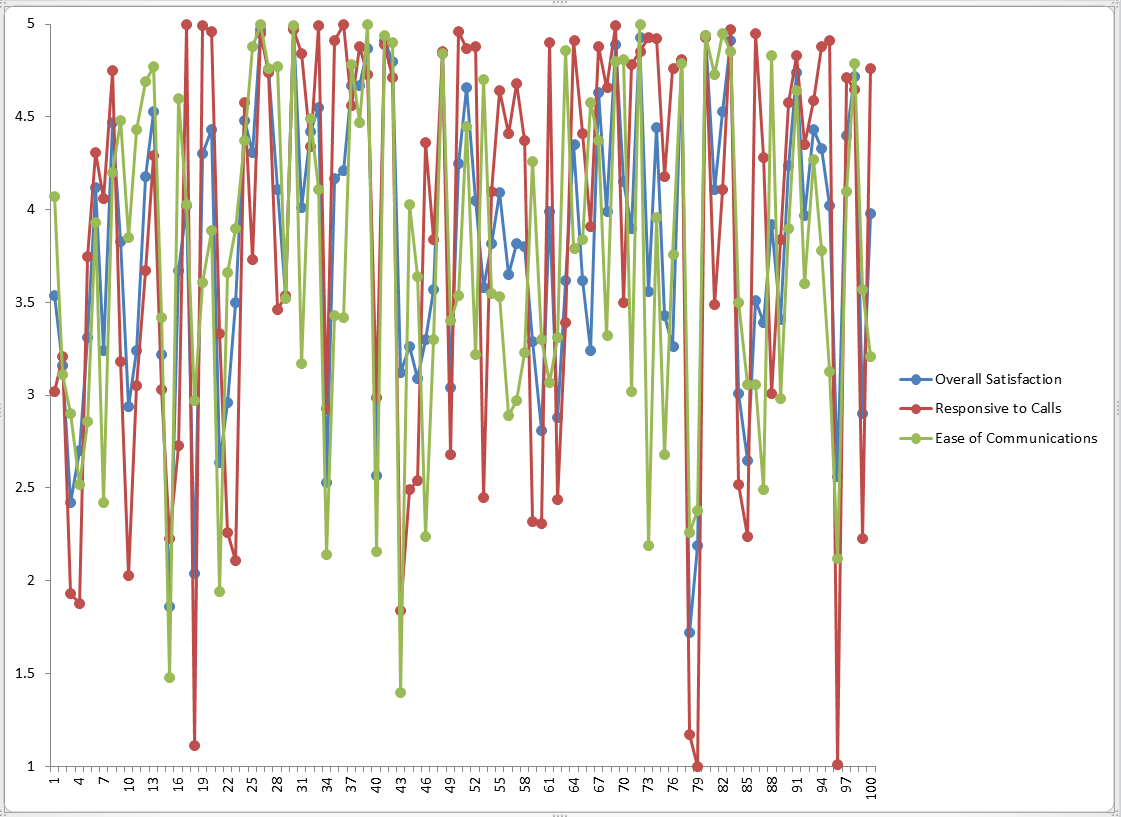
- Click OK. An Overlay Run Chart of Overall Satisfaction, Responsive to Calls and Ease of Communications is produced.
Define, Measure, Analyze, Improve, Control


Simulate, Optimize,
Realize

Web Demos
Our CTO and Co-Founder, John Noguera, regularly hosts free Web Demos featuring SigmaXL and DiscoverSim
Click here to view some now!
Contact Us
Phone: 1.888.SigmaXL (744.6295)
Support: Support@SigmaXL.com
Sales: Sales@SigmaXL.com
Information: Information@SigmaXL.com


