- LIVE HELP IS

How Do I Perform a Nonparametric Runs Test in Excel Using SigmaXL?
Nonparametric Runs Test for Randomness
The nonparametric runs test provides a test for randomness or independence. The null hypothesis is H0: The data is random (or independent). The alternative hypothesis is Ha: The data is not random (or independent). Note that this test is also provided as an option in Run Charts (SigmaXL > Graphical Tools > Run Chart). In addition to providing an overall test for randomness, 4 tests are performed to detect Clustering, Mixtures, Trends, and Oscillations. If any of these patterns are significant (typically using α = 0.01), we would need to take corrective action before proceeding with further statistical analysis. (Note that SigmaXL will highlight any p-values < .05 in red.)- Open Customer Data.xlsx, click Sheet 1 tab (or press
F4 to activate last worksheet).
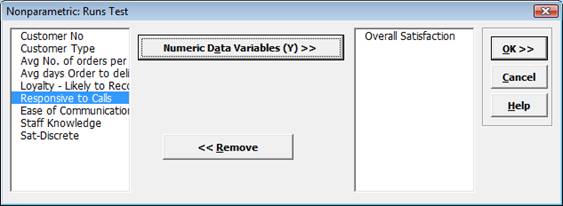
- Click SigmaXL > Statistical Tools > Nonparametric Tests > Runs Test. Ensure that the entire data table is selected. If not, check
Use Entire Data Table.
- Click Next. Select
Overall Satisfaction, click Numeric Data Variable (Y) >>:
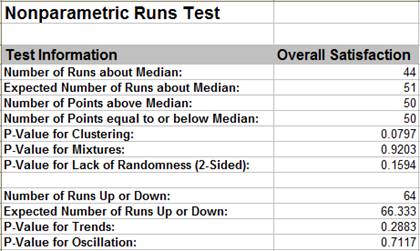
- Click OK. The resulting report is shown:
- With all of the p-values being greater than 0.01, we fail to reject H0, and conclude that the data is random (or statistically independent). Recall from the run chart of this data that there were no obvious trends or patterns.
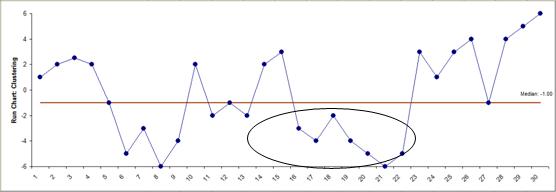
- Examples of Clustering, Mixtures, Trends, and Oscillations are given below using the Run Chart to illustrate. The data for these examples are given in the file
Runs Test Example Data.xls. (Use SigmaXL > Graphical Tools > Run Charts to create the run charts).
- Clustering appears as a group of points in one area of the chart. It may indicate special cause variation such as sampling or measurement problems.
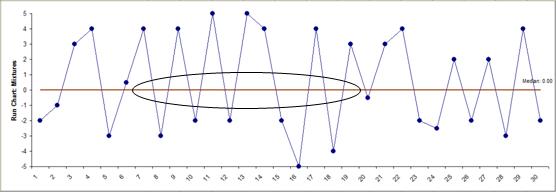
- Mixtures appear as an absence of data points near the center line. A mixture may indicate a bimodal distribution due to a regular change of shift, machinery, or raw materials.
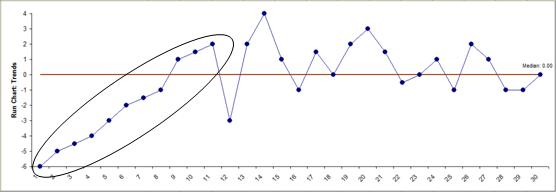
- Trends appear as an upward or downward drift in the data and may be due to special causes such as tool wear.
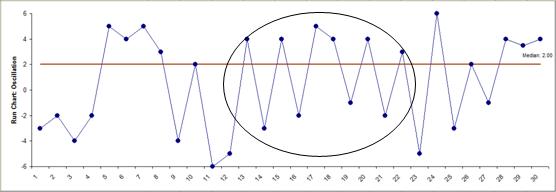
- Oscillations appear as rapid up/down fluctuations indicating process instability.
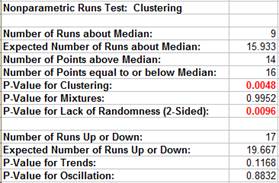
Note that the p-value for Mixtures = 1 – p-value for Clustering. They are mutually exclusive. The p-value for Lack of Randomness = 2 * minimum of (p-value Clustering, p-value Mixtures).
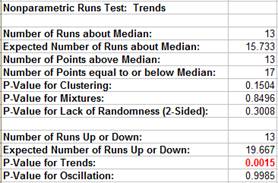
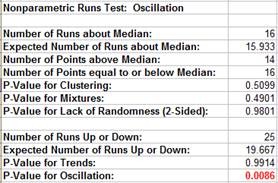
Note that the p-value for Trends = 1 – p-value for Oscillation. They are mutually exclusive.
Define, Measure, Analyze, Improve, Control


Simulate, Optimize,
Realize

Web Demos
Our CTO and Co-Founder, John Noguera, regularly hosts free Web Demos featuring SigmaXL and DiscoverSim
Click here to view some now!
Contact Us
Phone: 1.888.SigmaXL (744.6295)
Support: Support@SigmaXL.com
Sales: Sales@SigmaXL.com
Information: Information@SigmaXL.com


