- LIVE HELP IS

How Do I Create NP-Charts in Excel Using SigmaXL?
NP-Charts
- Open Attribute Data NP Chart Defectives.xlsx. The subgroup size is constant at 50. NP Charts (for Defectives) require a fixed subgroup size.
- Select SigmaXL > Control Charts > Attribute Charts> NP. Ensure that the entire data table is selected. If not, check Use Entire Data Table. Click Next.
- Select Defectives, click Numeric Data Variable (Y) >>;
enter 50 for Enter Subgroup Size. Check
Tests for Special Causes.
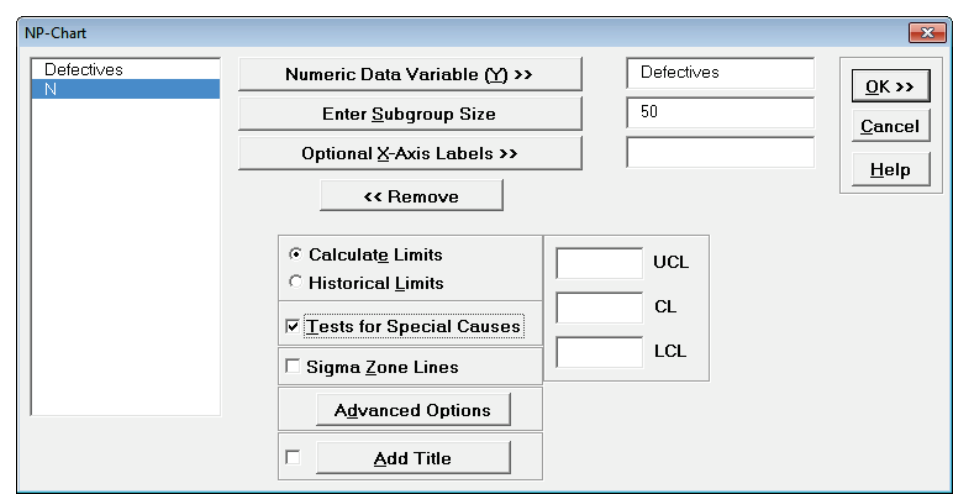
- Click OK. The resulting NP-Chart is shown:
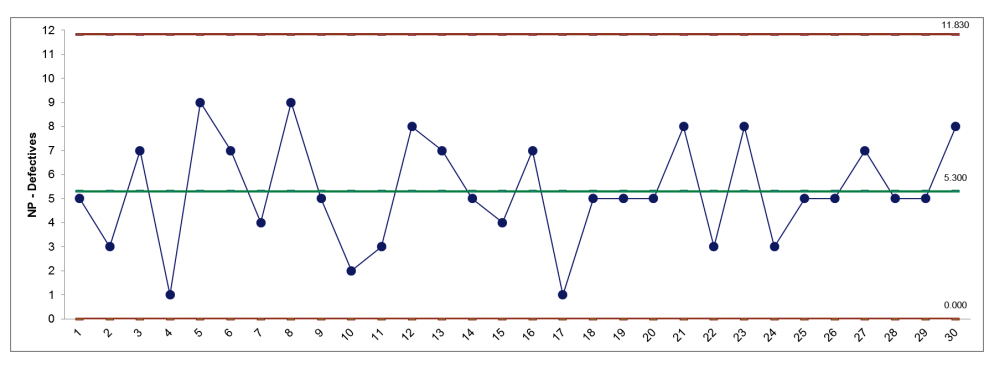
This is a stable process, with no tests for special causes flagged.
Define, Measure, Analyze, Improve, Control


Simulate, Optimize,
Realize

Web Demos
Our CTO and Co-Founder, John Noguera, regularly hosts free Web Demos featuring SigmaXL and DiscoverSim
Click here to view some now!
Contact Us
Phone: 1.888.SigmaXL (744.6295)
Support: Support@SigmaXL.com
Sales: Sales@SigmaXL.com
Information: Information@SigmaXL.com


