- LIVE HELP IS

How Do I Create a Basic Histogram in Excel Using SigmaXL?
Single (Basic) Histogram
-
Click Sheet 1 Tab of Customer Data.xlsx (or press F4 to activate last worksheet).
-
Click SigmaXL > Graphical Tools > Basic Histogram.
-
Ensure that entire data table is selected. If not, check Use Entire Data Table. Click Next.
-
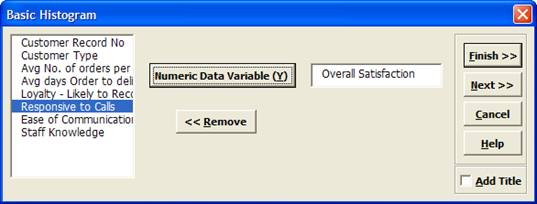
Select Overall Satisfaction, click Numeric Data Variable (Y) >> as shown:
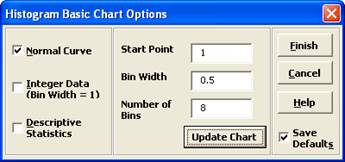
- Click Next. Ensure that Normal Curve is checked. Set Start Point = 1. Change the Bin Width to 0.5, and the Number of Bins to 8. Click Update Chart to view the histogram. (If the survey satisfaction data was pure integer format we would have checked the Integer Data option).
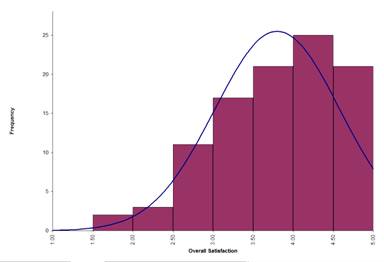
- Click Finish. A histogram of Overall Customer Satisfaction is produced.
- Note that bin one is 1 to < 1.5, bin 2 is 1.5 to < 2, etc.
Tip: Any graph produced by SigmaXL can be Copied/Pasted into Word. It can also be enlarged by clicking on the graph and dragging the corner. The number of decimal places displayed can be modified by clicking on the Axis Label and selecting the
Number tab to adjust. The text label alignment can
also be modified by selecting the Alignment tab.
Click here to download a Free 30-Day Trial.
Click here to download a Free 30-Day Trial.
Define, Measure, Analyze, Improve, Control


Simulate, Optimize,
Realize

Web Demos
Our CTO and Co-Founder, John Noguera, regularly hosts free Web Demos featuring SigmaXL and DiscoverSim
Click here to view some now!
Contact Us
Phone: 1.888.SigmaXL (744.6295)
Support: Support@SigmaXL.com
Sales: Sales@SigmaXL.com
Information: Information@SigmaXL.com


