Simulation and Optimization with DiscoverSim
- Home /
- DSIM-Sim And Opt

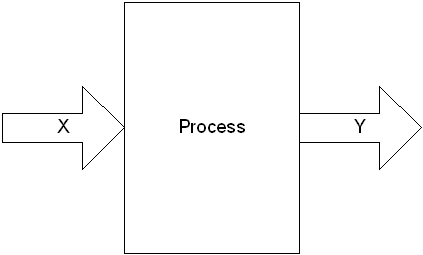
DiscoverSim utilizes the Y=f(X) model, where Y denotes a key process output response and X denotes a key process input. This is shown pictorially as:
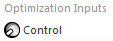
The DiscoverSim menu buttons to specify inputs are:

An input distribution is stochastic and includes random variation. It can be continuous or discrete. The most common continuous distribution is the normal distribution with parameters mean and standard deviation. DiscoverSim includes 53 continuous and 10 discrete distributions.
An input control is set to a constant value, but it can be varied like the temperature control knob of a thermostat and is used for optimization. An input control can be continuous or discrete.
The DiscoverSim menu button to specify an output response is:

A DiscoverSim model requires at least one input and one output. The output cell must contain an Excel formula that is a function of the inputs and references the cell address of the inputs or intermediate calculations including the inputs. The formula can be linear or non-linear and include Excel functions. The formula can reference other sheets within the workbook, but should not reference other workbooks.The DiscoverSim Excel Formula Interpreter is used to dramatically accelerate the speed of calculations during simulation or optimization. The Y = f(X) equation should be based on theory, process knowledge, or the prediction formula of a designed experiment or regression analysis. In Design for Six Sigma (DFSS), this is referred to as the Transfer Function. This prediction equation should be validated prior to use in DiscoverSim. As the eminent statistician George Box said, All models are wrong, some are useful, so while the model does not have to be exact, it should be a reasonable approximation of reality. The results of a DiscoverSim analysis should also be validated with further experimentation or use of prototypes.
The Y = f(X) model gives us a starting point in the relationship between X and Y. After the Y = f(X) relationship has been validated, an important question that then needs to be answered is: What does the distribution of Y look like when I cannot hold X constant, but have some uncertainty in X? In other words, How can I quantify my risk?
Take an example of a sales forecast. Y is the predicted monthly sales, which is a sum of forecasts from five different product line sales managers. If each manager simply reports a single most likely estimate, the total predicted sales will also be a single most likely estimate. The problem with this approach is obvious; it does not take the uncertainty into account. So what then should be done? In addition to the most likely estimates, each sales manager could include best and worst case estimates. Alternatively, an estimate of the mean and standard deviation could be reported.
The challenge then becomes how to best take the uncertainty into account. One could simply sum the best and worst case values (or the +/-3 standard deviation values), and thus report the total range. This approach, however, is unsatisfactory because it does not take into account the very low likelihood that each line will simultaneously have a best case or worst case value. This would be akin to rolling 5 dice and getting 5 ones or 5 sixes.
If each of the sales managers assume a normal distribution, the distribution for total sales will also be normal with:
Total Mean = Mean1 + + Mean5
Total StdDev = SQRT( (StdDev1)2 ++ (StdDev5)2).
If, however, some of the product lines have correlated sales, i.e., an increase in sales for product A also means an increase in sales for product B, then things get complicated. The StdDev formula given above does not hold because it assumes independence. Further complications arise if the sales managers need to use different distributions or if the total sales involve more than a simple sum. This is where Monte-Carlo simulation comes in to solve the complex problem of dealing with uncertainty by brute force using computational power.
The Monte Carlo method was coined in the 1940s by John von Neumann, Stanislaw Ulam and Nicholas Metropolis, while they were working on nuclear weapon projects in the Los Alamos National Laboratory. It was named in homage to Monte Carlo casino, a famous casino, where Ulam's uncle would often gamble away his money (Ref: https://en.wikipedia.org/wiki/Monte_Carlo_method )
A random draw is performed from each input distribution, Y is calculated, and the process is repeated 10,000 times. The histogram and descriptive statistics show the simulation results. While not shown here, requirements (specification limits) can easily be added to Y to obtain probability of nonconformance.
Notice that even though input distributions A2 and A3 are not normal, the distribution for the total is normal. This is due to the central limit theorem. Of course, this will not always be the case when performing a Monte-Carlo simulation!
The areas of application for Monte-Carlo simulation are very wide, including Design for Six Sigma (DFSS), Tolerance Design, Project Management and Risk Management with common use in Engineering, Finance, Telecommunications and Oil & Gas Exploration.
The following books are recommended for further reading:
Savage, Sam (2009), The Flaw of Averages: Why We Underestimate Risk in the Face of Uncertainty, Hoboken, NJ, Wiley. Sleeper, Andrew (2006), Design for Six Sigma Statistics: 59 Tools for Diagnosing and Solving Problems in DFSS Initiatives, NY, McGraw-Hill.
There are two components to uncertainty: one is the actual process variation, and the second is measurement error or error due to lack of knowledge. The contribution of the latter can be incorporated into a model, but for simplicity in our discussions and case studies, we will assume that the measurement error is negligible.
Selecting the correct distribution is a critical step towards building a useful model.
The best choice for a distribution is one based on known theory, for example, the use of a Weibull Distribution for reliability modeling.
A common distribution choice is the Normal Distribution, but this assumption should be verified with data that passes a normality test with a minimum sample size of 30; preferably 100.
If data is available and the distribution is not normal, use DiscoverSims Distribution Fitting tool to find a best fit distribution. Alternatively, the Pearson Family Distribution allows you to simply specify Mean, StdDev, Skewness and Kurtosis.
In the absence of data or theory, commonly used distributions are: Uniform, Triangular and PERT. Uniform requires a Minimum and Maximum value, and assumes an equal probability over the range. This is commonly used in tolerance design. Triangular and PERT require a Minimum, Most Likely (Mode) and Maximum. PERT is similar to Triangular, but it adds a bell shape and is popular in project management.
The following tables summarize of all distributions in DiscoverSim (** denotes with/without Threshold).
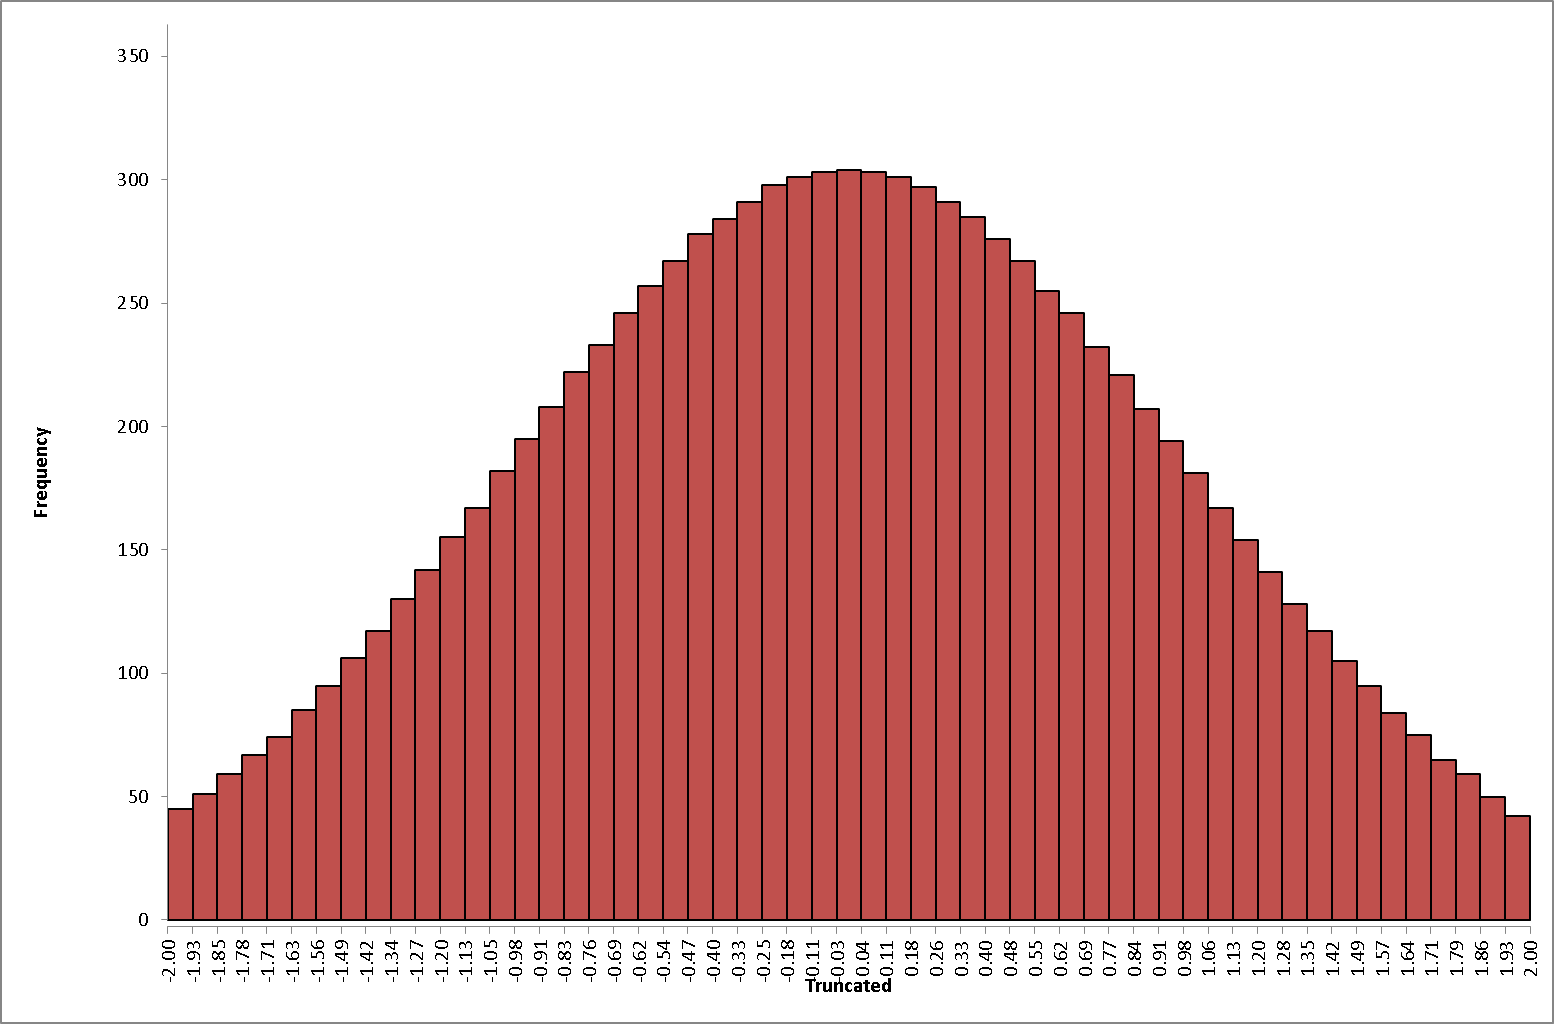
DiscoverSim allows you to specify truncation values for any input distribution. For example, a truncated normal distribution would be appropriate if you have a component supplier that starts with a normal distribution, then rejects the parts that fail the lower and upper specification, and ships you the good parts.
The following histogram illustrates a truncated normal distribution (mean = 0, stdev = 1) with minimum = -2 and maximum = 2.
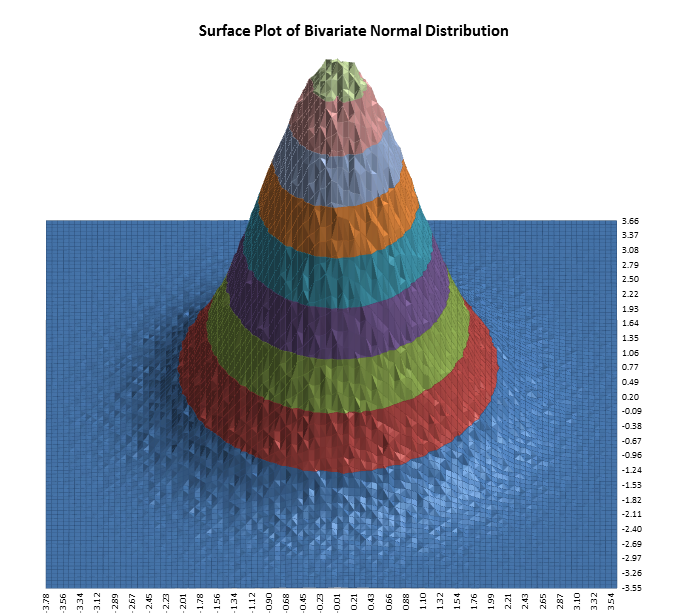
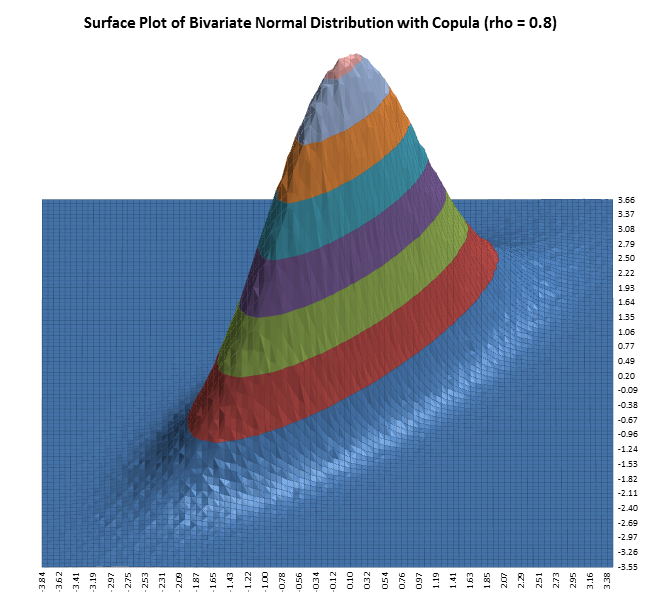
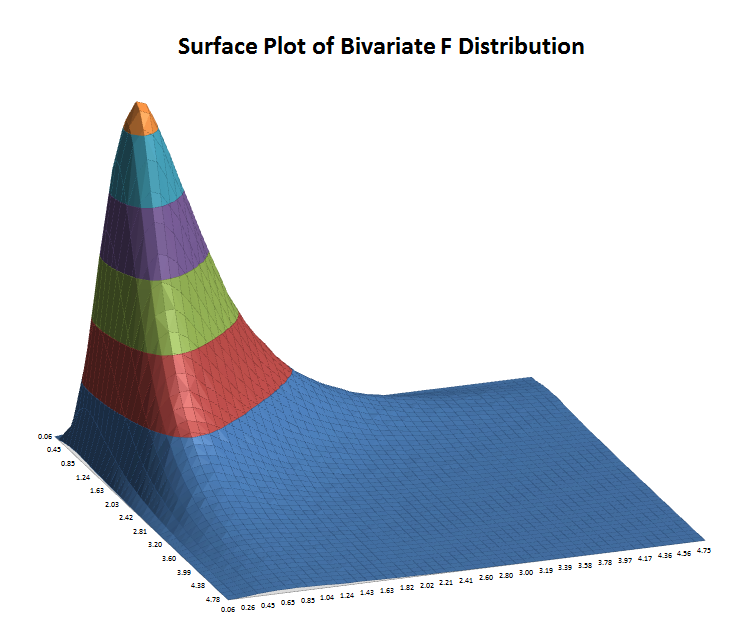
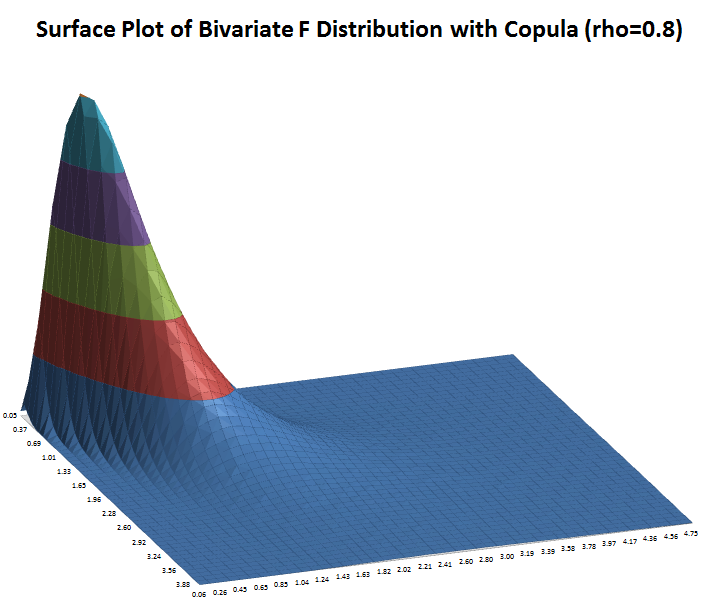
DiscoverSim allows you to specify correlations between any inputs. DiscoverSim utilizes correlation copulas to achieve the desired Spearman Rank correlation values.
The following surface plots illustrate how a correlation copula results in a change in the shape of a bivariate (2 input) distribution:
Monte-Carlo simulation enables you to quantify risk, whereas stochastic optimization enables you to minimize risk. Deterministic optimization is a more commonly used tool but has the same drawback as the single number estimate method described above in the introduction to Monte Carlo simulation; it does not take uncertainty into account. Stochastic optimization will not only find the optimum X settings that result in the best mean Y value, it will also look for a solution that will reduce the standard deviation.
Deterministic optimization will look for a minimum or maximum, whereas stochastic optimization looks for a minimum or maximum that is robust to variation in X, thus reducing the transmitted variation in Y. This is referred to as Robust Parameter Design in Design For Six Sigma (DFSS).
Local optimization methods are good at finding local minima, use derivatives of the objective function to find the path of greatest improvement, and have fast convergence. However, they require a smooth response so will not work with discontinuous functions. DiscoverSim uses Sequential Quadratic Programming (SQP) for local optimization.
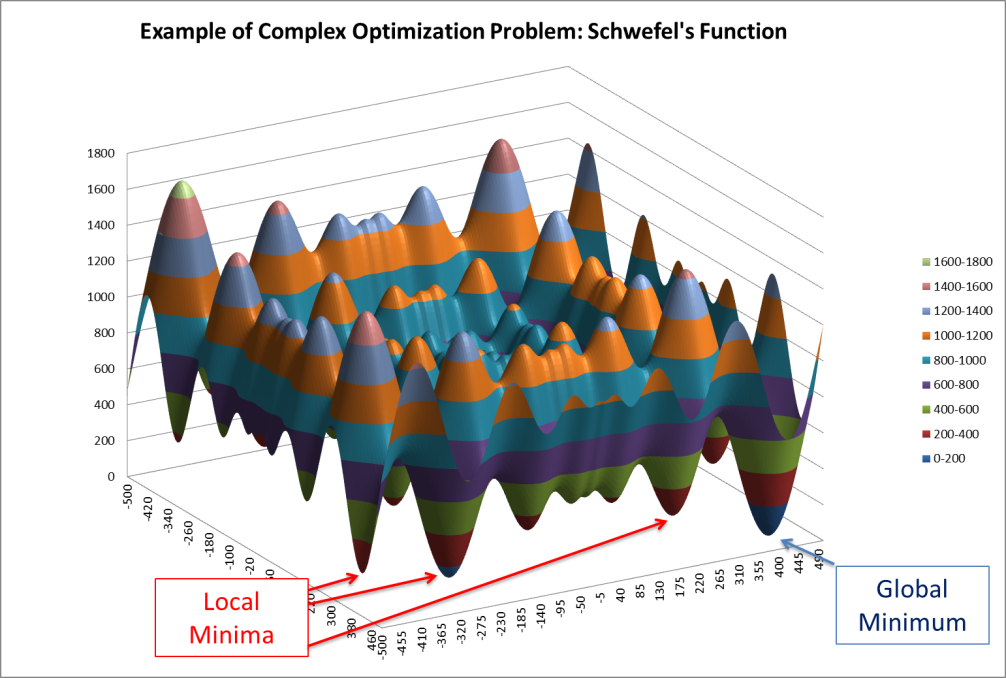
Global optimization finds the global minimum, and is derivative free, so will work with discontinuous functions. However, because of the larger design space, convergence is much slower than that of local optimization. DiscoverSim uses DIRECT (Dividing Rectangles) and Genetic Algorithm (GA) for global optimization.
A hybrid of the above methodologies is also available in DiscoverSim, starting with DIRECT to do a thorough initial search, followed by GA, and then fine tuning with SQP.
The following surface plot illustrates a function with local minima and a global minimum.
Output: The output will be a function of the model equation, intermediate cell calculations, as well as input distributions and input controls.
Input Control: The permissible range for the control is specified, and the control, which unlike an input distribution, has no statistical variation. Think of this as the temperature control knob of a thermostat. This is also known as a Decision Variable. An input control can be referenced by an input distribution parameter, constraint and/or an output function. It is possible to have a model that consists solely of controls with no input distributions. (In this case, the optimization is deterministic, so the number of replications, n, should be set to 1.) An input control can be continuous or discrete integer.
Constraint: A constraint can only be applied to an Input Control and cannot reference an Input Distribution or Output Response. A constraint cannot be a part of the model equation (i.e., an output cannot reference a constraint). Constraints can be simple linear or complex nonlinear. Each constraint will contain a function of Input Controls on the Left Hand Side (LHS), and a constant on the Right Hand Side (RHS). The constraint formula is specified in the LHS.


