- LIVE HELP IS

How Do I Create and Analyze a Gage R&R (Crossed) Worksheet in Excel Using SigmaXL?
Create Gage R&R (Crossed Worksheet)
- To create a blank Gage R&R worksheet, click SigmaXL > Measurement Systems Analysis > Create Gage R&R (Crossed) Worksheet. A crossed Gage R&R study means that every operator/appraiser will measure every part/sample.
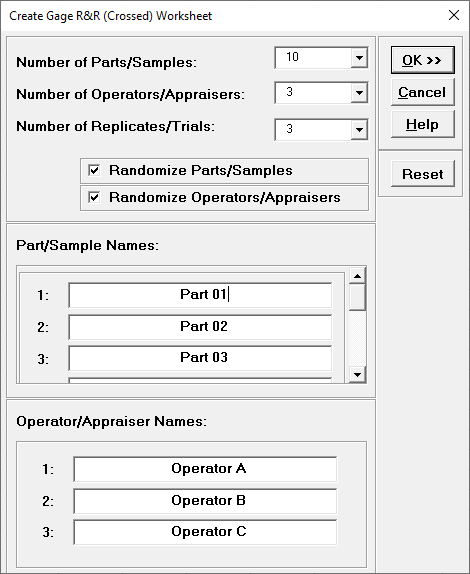
- The default settings are 10 Parts, 3 Operators, 3 Replicates with Parts and Operators randomized. Clicking the Reset button will restore the dialog to these default settings.
- Part and Operator names can be edited.
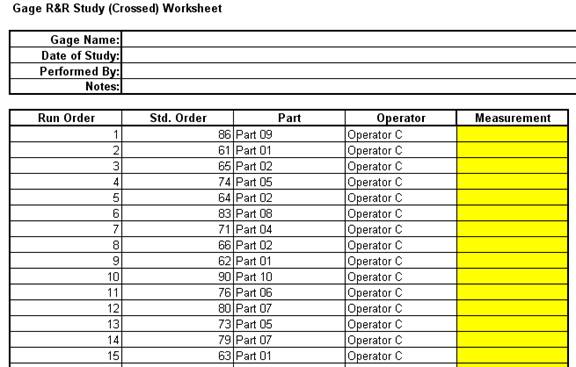
- Click OK. The following worksheet is produced:
- Your worksheet order will be different due to the randomization. The results of the Gage R&R study are entered in the yellow highlighted Measurement cells.
Analyze Gage R&R (Crossed)
- Open the file Gage RR – AIAG.xlsx. This is an example from the Automotive Industry Action Group (AIAG) MSA Reference Manual, 3rd Edition, page 101. Note that parts were measured in random order, but the worksheet is given in standard order.
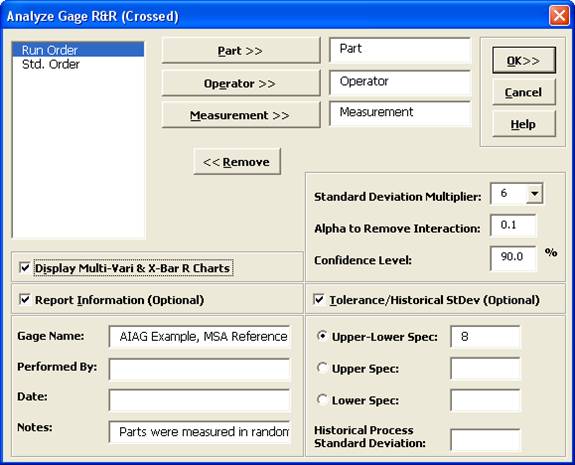
- Click SigmaXL > Measurement Systems Analysis > Analyze Gage R&R (Crossed). The data worksheet is recognized by SigmaXL and highlighted automatically. Click Next.
- Select Part, Operator and Measurement as shown. Check Display Multi-Vari & X-Bar R Charts. Check Tolerance/Historical StDev (Optional) and enter 8 for the Process Tolerance Upper-Lower Spec.
- Click OK. The following Gage R&R Study Report is produced:
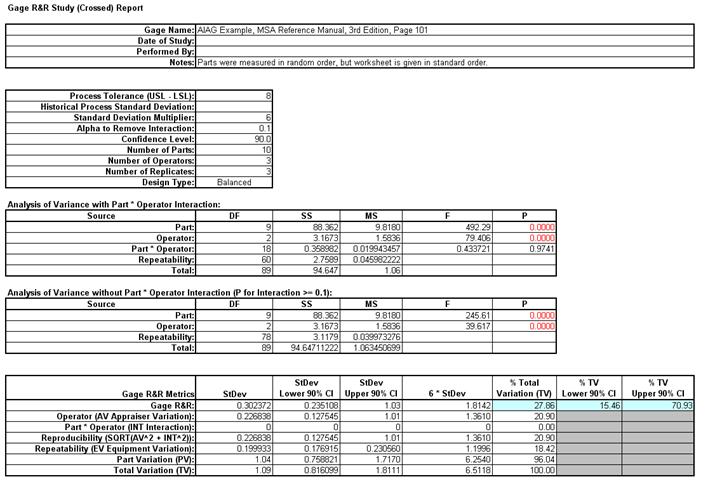
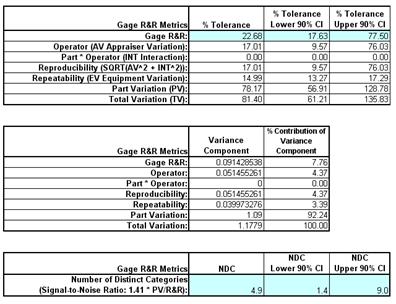
- The first ANOVA table shows that the Operator * Part Interaction is not significant with the P-value = 0.9741 (greater than the alpha-to-remove value of 0.1). The second ANOVA table shows the results excluding the Part * Operator Interaction.
- The cells shaded in light blue highlight the critical metrics: Gage R&R % Total Variation (also known as %R&R) and %Tolerance: < 10% indicates a good measurement system; > 30% indicates an unacceptable measurement system. The Number of Distinct Categories should be at least 5. Initial analysis shows that this is a marginal measurement system. (Traditionally NDC is truncated to an integer value, but SigmaXL reports a more informative one decimal place).
- SigmaXL also reports the confidence intervals for the Gage R&R metrics. Note that when the confidence intervals are taken into account, it is possible that this measurement system is totally inadequate. This strongly suggests that the measurement system needs to be improved but it also points out the weakness of the traditional Gage R&R study with 10 Parts, 3 Operators, and 3 Replicates. These sample sizes will typically yield wide confidence intervals. For statistical details of the Gage R&R confidence intervals see Burdick, R. K., Borror, C. M., and Montgomery, D. C., “Design and Analysis of Gauge R&R Studies: Making Decisions with Confidence Intervals in Random and Mixed ANOVA Models”, ASA-SIAM Series on Statistics and Applied Probability, 2005.
- Click on the Gage R&R – Multi-Vari Sheet
tab to view the Multi-Vari Chart:
- Click on the Gage R&R – X-Bar R Sheet tab to view the X-Bar & R Chart:
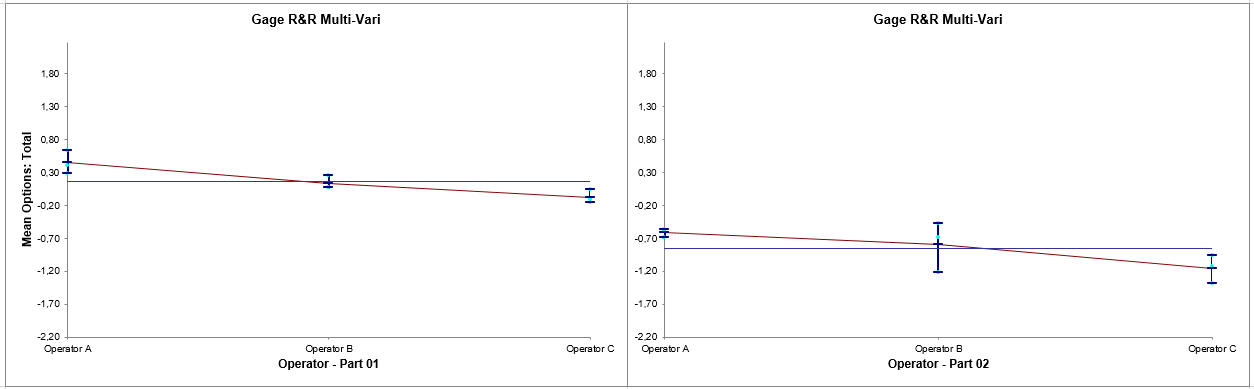
The Multi-Vari chart shows each Part as a separate graph. Each Operator’s response readings are denoted as a vertical line with the top tick corresponding to the Maximum value, bottom tick is the Minimum, and the middle tick is the Mean. The horizontal line across each graph is the overall average for each part.
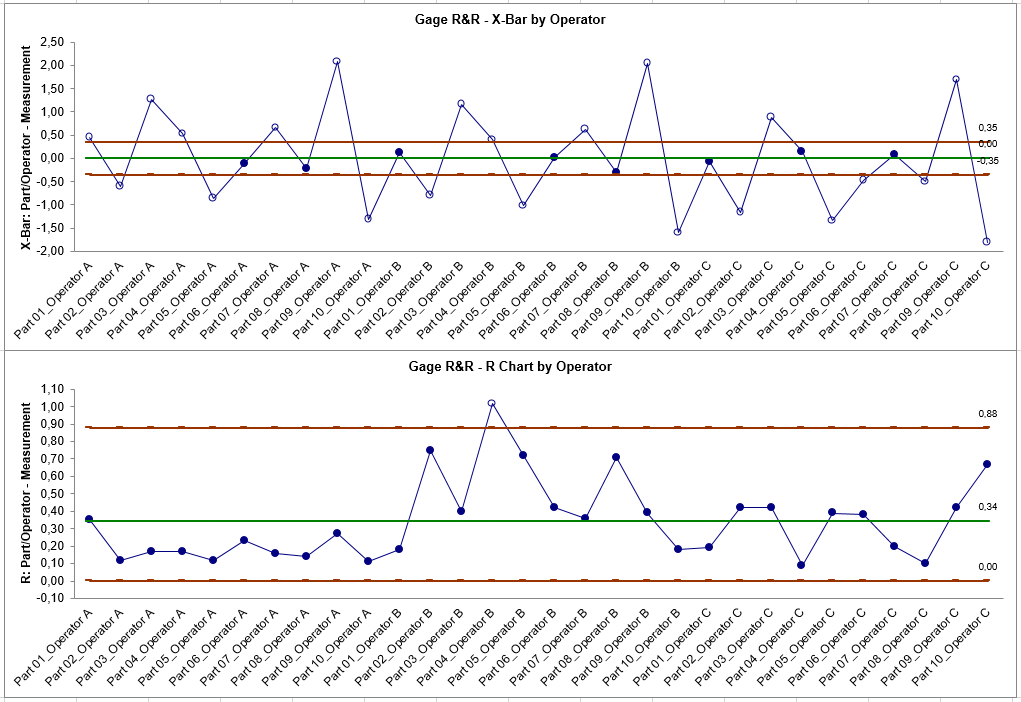
When interpreting the X-bar and R chart for a Gage R&R study, it is desirable that the X-bar chart be out-of-control, and the Range chart be in-control. The control limits are derived from within Operator repeatability. The Range chart indicates a problem with Operator B being inconsistent.
Define, Measure, Analyze, Improve, Control


Simulate, Optimize,
Realize

Web Demos
Our CTO and Co-Founder, John Noguera, regularly hosts free Web Demos featuring SigmaXL and DiscoverSim
Click here to view some now!
Contact Us
Phone: 1.888.SigmaXL (744.6295)
Support: Support@SigmaXL.com
Sales: Sales@SigmaXL.com
Information: Information@SigmaXL.com


