Chi-Square Test – Two-Way Table Data: Advanced Tests and Measures of Association – Nominal Categories
Checking the Nominal Categories option provides additional chi-square statistics and measures of association, including:
-
Adjusted Residual
- Equivalent to normal z score
- Red font highlight denotes significant cell residual
value
- Bold red highlight denotes significant cell residual
value with Bonferroni adjustment
- Note: red highlight is only active if Chi-Square P-Value
is significant
- Cell’s Contribution to Chi-Square
- Additional Chi-Square Tests
- Likelihood Ratio
- McNemar-Bowker Symmetry (Square Table)
- For a 2x2 table, McNemar’s test is equivalent to a
paired two-proportions test, for example applicable to
studying before versus after change in proportion on the
same subject. The returned P-Value is exact, based on the
binomial distribution.
- Bowker extended McNemar’s test for square tables larger
than 2x2. The null hypothesis is that the table is
symmetrical (i.e., symmetry of disagreement). This uses
Chi-Square as the test statistic.
- Measures of Association for Nominal Categories
- Pearson’s Phi is equivalent to Pearson’s correlation
coefficient for a 2x2 table. It is the most popular measure
of association for 2x2 tables.
- We recommend the following rules-of-thumb, adapted from
Cohen (1988):
- < 0.1 = Very Weak
- 0.1 to < 0.3: Weak (“Small” Effect)
- 0.3 to < 0.5: Moderate (“Medium” Effect)
- > 0.5: Strong (“Large” Effect)
- Although Phi is equivalent to Pearson’s correlation for
a 2x2 table, we recommend these rules-of-thumb for use in
typical contingency tables, rather than those commonly used
for correlation (i.e., > 0.9 = Strong).
- Cramer’s V
- Cramer's V is an extension of Phi for larger tables.
It is the most popular measure of association for tables
of any size.
- It varies from 0 to 1, with 0 = no association and 1
= perfect association.
- Use Cohen’s rules-of-thumb given above for Phi.
- Contingency Coefficient
- An alternative to Phi, varies from 0 to < 1.
- Use Cohen’s rules-of-thumb given above for Phi.
- Cohen's Kappa (Agreement - Square Table)
- Kappa is used to measure agreement between two
assessors evaluating the same parts or items.
- For an extended Attribute Measurement Systems
Analysis use SigmaXL > Measurement Systems
Analysis > Attribute MSA.
For Attribute MSA used in Six Sigma quality,
the recommendation is Kappa > 0.9 is strong agreement
and < 0.7 is weak agreement, but for general use, the
less stringent guidelines by Fleiss are recommended:
Kappa: >= 0.75 or so signifies excellent agreement, for
most purposes, and <= 0.40 or so signifies poor
agreement.
- Goodman-Kruskal Lambda & Tau and Theil's Uncertainty
- Measures of Proportional Reduction in Predictive
Error. The basic concept is a measure that indicates how
much knowing the value of the independent variable
improves our ability to estimate the value of the
dependent variable.
- They are Directional Measures. If the Y dependent
variable is in the Rows Category, then
use the Rows Dependent measure. If the Y dependent
variable is in the Columns Category, then use the Cols
Dependent measure. If there is no clear X-Y
dependent-independent relationship, then use the
Symmetric measures (not available for Tau).
- Use Cohen’s rules-of-thumb for these measures.
- Press F3 or click Recall SigmaXL Dialog to recall last
dialog. Check Nominal Categories as shown:
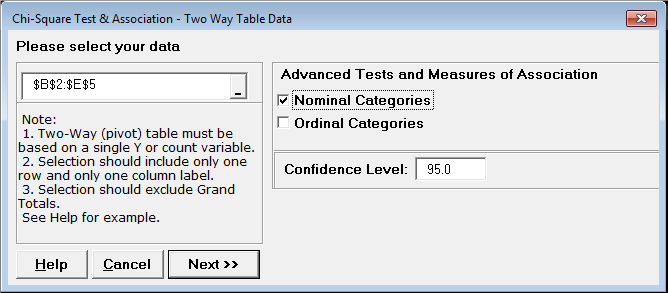
- Click Next. The resulting output is:
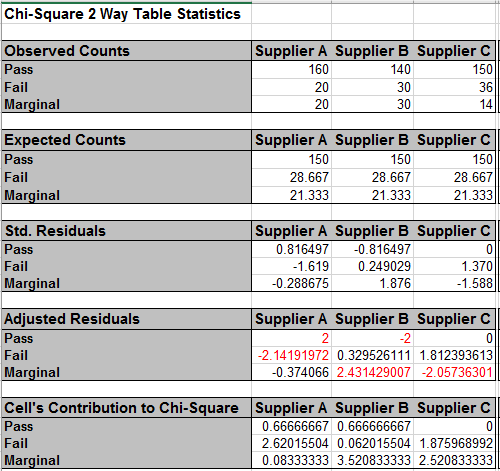
The adjusted residuals are equivalent to normal z values, so for
a specified 95% confidence level, any value greater than 1.96
(or less than -1.96) is highlighted in red. This results in a
slight difference in interpretation from that of the
standardized residuals, but the 3 largest magnitude residuals
are consistent.

As noted above, the Chi-Square P-Value tells us that there is a
significant difference across suppliers, in other words, there
is association between Supplier and Pass/Fail/Marginal, but it
does not tell us the degree or strength of that association.
Cramer’s V is used for tables larger than 2x2 and from the
rules-of-thumb, the 0.1 value is considered weak (or small
effect).


