- LIVE HELP IS

How Do I Create an Attribute MSA Report in Excel Using SigmaXL?
Attribute MSA is also known as Attribute Agreement Analysis. Use the Ordinal option if the assessed result is numeric ordinal (e.g., 1, 2, 3, 4, 5). There must be at least 3 response levels in the assessed result, otherwise it is binary. Examples of ordinal responses used elsewhere in this workbook include:
- Customer Loyalty –Likely to Recommend score which contains ordinal integer values from 1 to 5, where a 1 indicates that the customer is very unlikely to recommend and a 5 indicates that the customer is very likely to recommend.
- Taste Score on a scale of 1-7 where 1 is "awful" and 7 is "delicious." This is used in the cake bake taste test Design of Experiments.
An Ordinal Attribute MSA study should be done prior to formal ordinal data collection for use in hypothesis testing, regression or design of experiments.
- Open the file Attribute MSA – Ordinal.xlsx. This is an Ordinal MSA example with 50 samples, 3 appraisers and 3 trials. The response is 1 to 5, grading product quality. One denotes “Very Poor Quality,” 2 is “Poor,” 3 is “Fair,” 4 is “Good” and a 5 is “Very Good Quality.” The Expert Reference column is the reference standard from an expert appraisal. Note that the worksheet data must be in stacked column format and the reference values must be consistent for each sample.
- Click SigmaXL > Measurement Systems Analysis > Attribute MSA (Ordinal). Ensure that the entire data table is selected. Click Next.
- Select Sample No., Appraiser, Assessed Result and Expert Reference as shown. Check Report Information and enter Attribute MSA Ordinal for Product/Unit Name. Select Percent Confidence Interval Type – Wilson Score:
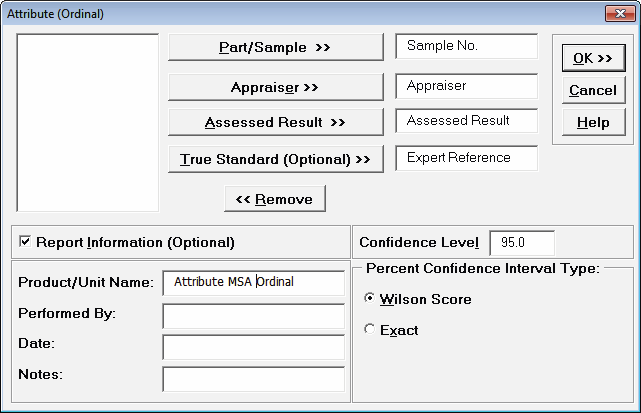
- Click OK. The Attribute MSA Ordinal Analysis Report is produced.
Tip: While this report is quite extensive, a quick assessment of the attribute measurement system can be made by viewing the Kendall Concordance and Kendall Correlation color highlights: Green - very good agreement; Yellow - marginally acceptable, improvement should be considered; Red - unacceptable. Further details on the Kendall Coefficients are given below.Tip: Fleiss’ Kappa and Percent Agreement are included in the report for completeness but not recommended for use with Ordinal response data because they treat each response level as nominal. Kendall’s Concordance and Correlation take the order of the data into account, so a deviation of 1 is not as bad as a deviation of 2 or more. See Attribute MSA – Nominal for a discussion of the Fleiss’ Kappa report.
Tip: Fleiss’ Kappa and Percent Agreement are included in the report for completeness but not recommended for use with Ordinal response data because they treat each response level as nominal. Kendall’s Concordance and Correlation take the order of the data into account, so a deviation of 1 is not as bad as a deviation of 2 or more. See Attribute MSA – Nominal for a discussion of the Fleiss’ Kappa report.
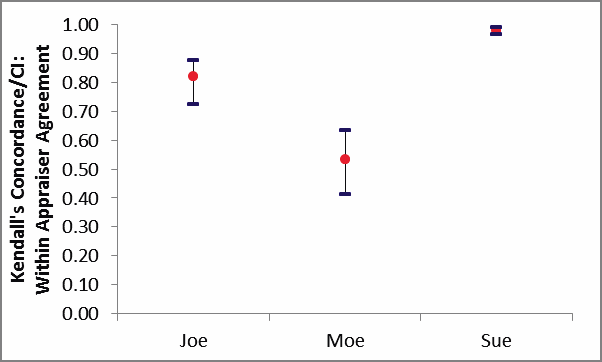
Kendall’s Concordance/CI Within Appraiser Agreement Graph:
Within Appraiser Agreement Table:

Between Appraiser Agreement Table:
![]()
Kendall's Coefficient of Concordance (Kendall's W) is a measure of association for discrete ordinal data, used for assessments that do not include a known reference standard. Kendall’s coefficient of concordance ranges from 0 to 1: A coefficient value of 1 indicates perfect agreement. If the coefficient = 0, then the agreement is random, i.e., the same as would be expected by chance. “Rule-of-thumb” interpretation guidelines: >= 0.9 very good agreement (green); 0.7 to < 0.9 marginally acceptable, improvement should be considered (yellow); < 0.7 unacceptable (red).
Kendall's Concordance P-Value: H0: Kendall's Coefficient of Concordance = 0. If P-Value < alpha (.05 for specified 95% confidence level), reject H0 and conclude that agreement is not the same as would be expected by chance. Significant P-Values are highlighted in red. See Appendix Kendall’s Coefficient of Concordance for further details on the Kendall Concordance calculations and “rule-of-thumb” interpretation guidelines.
Kendall's Concordance LC (Lower Confidence) limit and Kendall's Concordance UC (Upper Confidence) limit cannot be solved analytically, so are estimated using bootstrapping. Interpretation Guidelines: Concordance lower confidence limit >= 0.9: very good agreement. Concordance upper confidence limit < 0.7: the attribute agreement is unacceptable. Wide confidence intervals indicate that the sample size is inadequate.
The Within Appraiser Agreement for Joe is marginal, Moe is unacceptable and Sue is very good.
The Between Appraiser Agreement is unacceptable.
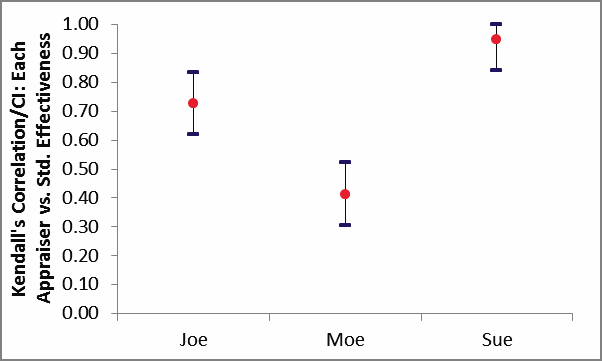
Kendall’s Correlation/CI Each Appraiser vs. Standard Effectiveness Graph:
Each Appraiser vs. Standard Agreement Table:

All Appraisers vs. Standard Agreement Table:
![]()
Each Appraiser vs. Standard Effectiveness Table:

![]()
Kendall's Correlation Coefficient (Kendall's tau-b) is a measure of association for discrete ordinal data, used for assessments that include a known reference standard. Kendall’s correlation coefficient ranges from -1 to 1: A coefficient value of 1 indicates perfect agreement. If the coefficient = 0, then the agreement is random, i.e., the same as would be expected by chance. A coefficient value of -1 indicates perfect disagreement. “Rule-of-thumb” interpretation guidelines: >= 0.8 very good agreement (green); 0.6 to < 0.8 marginally acceptable, improvement should be considered (yellow); < 0.6 unacceptable (red).
Kendall's Correlation P-Value: H0: Kendall's Correlation Coefficient = 0. If P-Value < alpha (.05 for specified 95% confidence level), reject H0 and conclude that agreement is not the same as would be expected by chance. Significant P-Values are highlighted in red.
Kendall's Correlation LC (Lower Confidence) and Kendall's Correlation UC (Upper Confidence) limit use a normal approximation. Interpretation Guidelines: Correlation lower confidence limit >= 0.8: very good agreement. Correlation upper confidence limit < 0.6: the attribute agreement is unacceptable. Wide confidence intervals indicate that the sample size is inadequate.
Tip: Kendall’s Correlation values in the Effectiveness tables are very similar to those in the Agreement tables (the slight difference is due to average Kendall for unstacked versus Kendall for stacked data). This is why the Kendall’s Correlation/CI Each Appraiser vs. Standard Agreement graph is not shown. It would essentially be a duplicate of the Kendall’s Correlation/CI Each Appraiser vs. Standard Effectiveness graph.
Appraiser Joe has marginal agreement versus the standard values. Appraiser Moe has unacceptable agreement to the standard. Sue has very good agreement to the standard.
Overall, the appraisers have marginal agreement to the standard.
Note that the Percent Agreement results in All Appraisers vs. Standard Agreement Table show only 2% agreement! This is due to the requirement that all appraisers agree with the standard across all trials for a 5 level response, which is very unlikely to occur. This highlights the problem with using Percent Agreement in an Ordinal MSA. Kendall’s coefficients are the key metric to assess an Ordinal MSA.
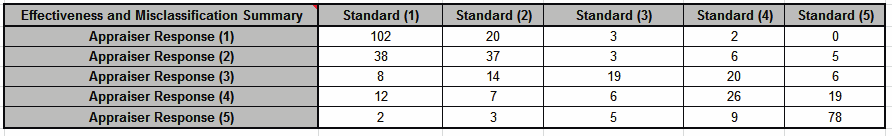
Effectiveness and Misclassification Summary is a summary table of all appraisers’ correct rating counts and misclassification counts compared to the known reference standard values.
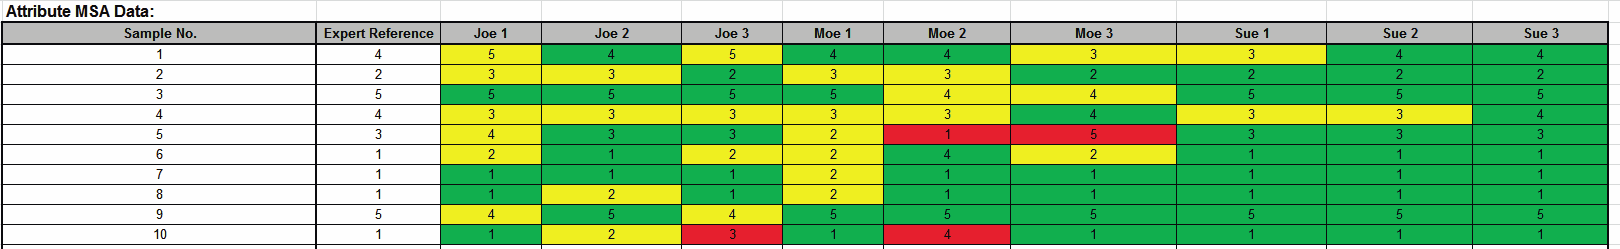
Attribute MSA Data is a summary showing the original data in unstacked format. This makes it easy to visually compare appraiser results by part. If a reference standard is provided, the cells are color highlighted as follows: absolute deviation = 0 (green); absolute deviation = 1 (yellow); absolute deviation >=2 (red):
In conclusion, this measurement system is marginal and should be improved. Appraiser Moe needs training and Appraiser Joe needs a refresher. Sue has very good agreement based on Kendall’s Concordance and Correlation, but would have been considered marginal based on Kappa (< .9) and Percent Effectiveness (< 95%). As discussed above, Kappa and Percent Effectiveness do not take the order of the response data into account, so are not as useful as Kendall’s coefficients in an Ordinal MSA study.
Define, Measure, Analyze, Improve, Control


Simulate, Optimize,
Realize

Web Demos
Our CTO and Co-Founder, John Noguera, regularly hosts free Web Demos featuring SigmaXL and DiscoverSim
Click here to view some now!
Contact Us
Phone: 1.888.SigmaXL (744.6295)
Support: Support@SigmaXL.com
Sales: Sales@SigmaXL.com
Information: Information@SigmaXL.com


